

After a quiet wintertime, the conference season has officially started! As a researcher, you experience certain peak-times during the year, which are often related to… conferences. For example, in August we usually have to submit papers for international conferences. In January, we submit papers for national conferences held in summer. And just before the international conferences which usually start in April, we have to finish our analyses, write papers and prepare for meetings with our international colleagues who are sometimes our advisors, co-authors or make up our reference-list.
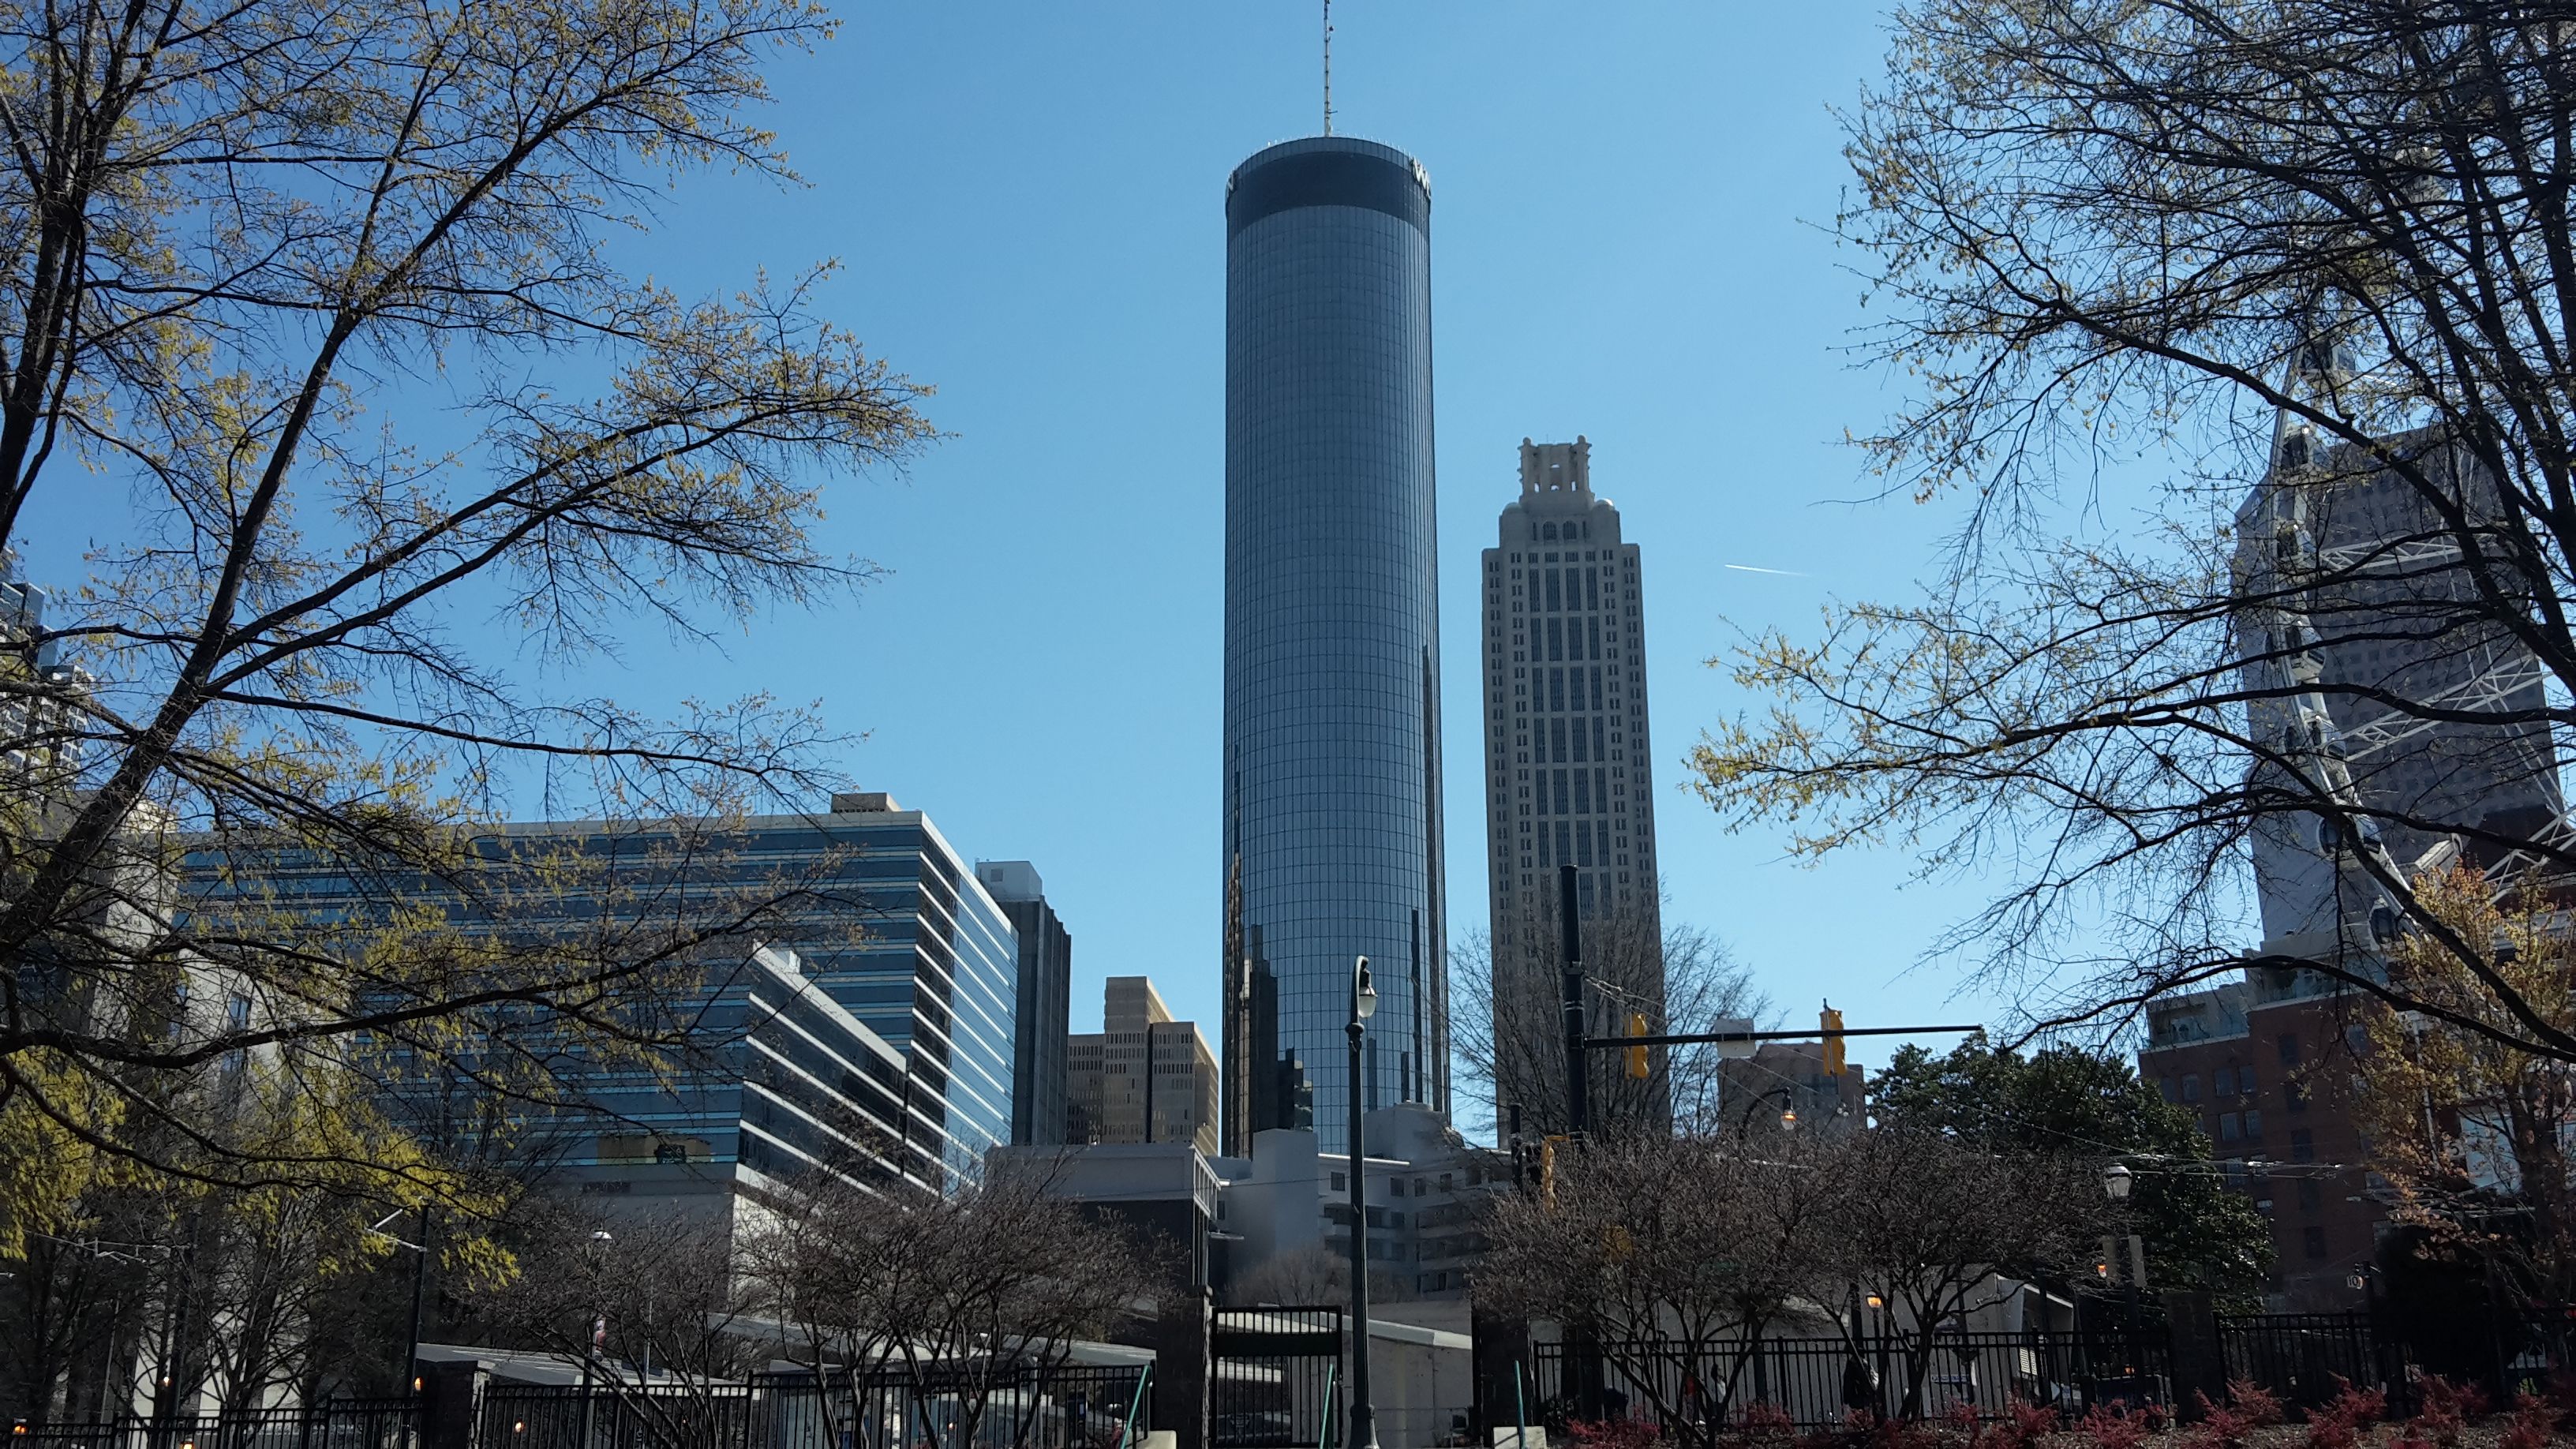
As a lot of ICLON researchers will attend AERA (American Educational Research Association) in New York this year, I will write this blog about a different conference which not so many ICLONners attended: the NARST (National Association for Research in Science Teaching) in Atlanta, US.
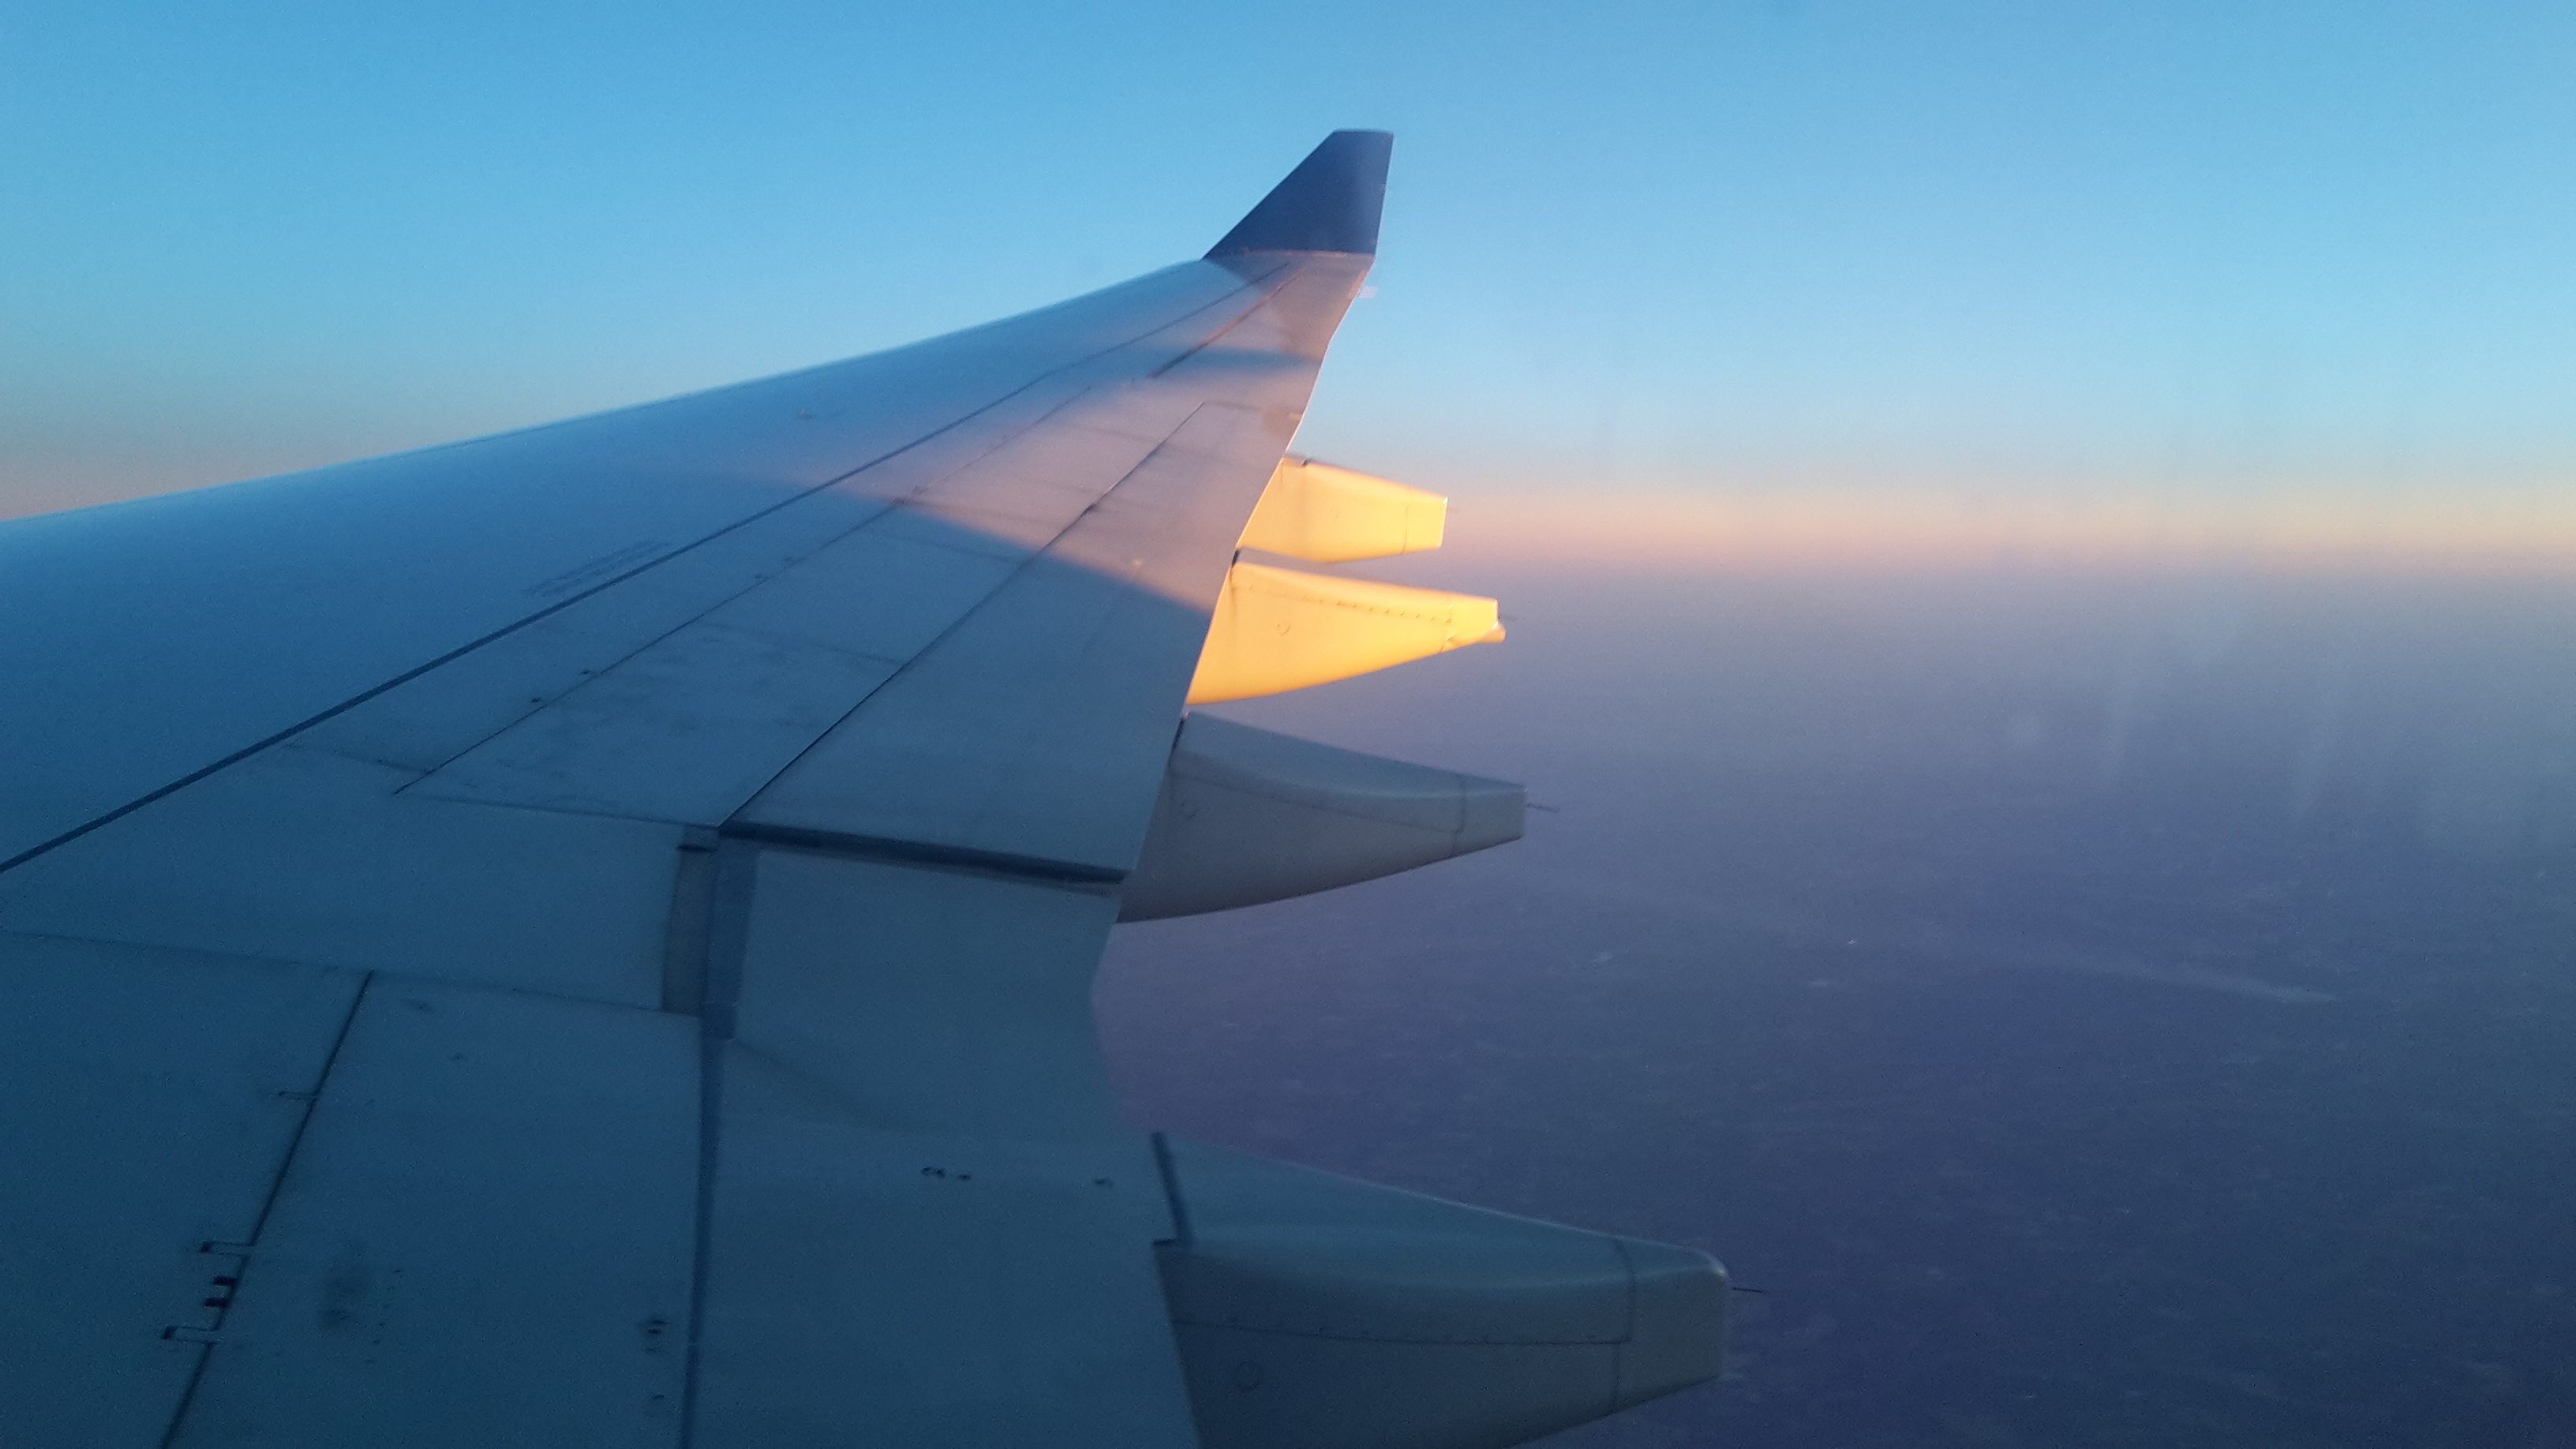
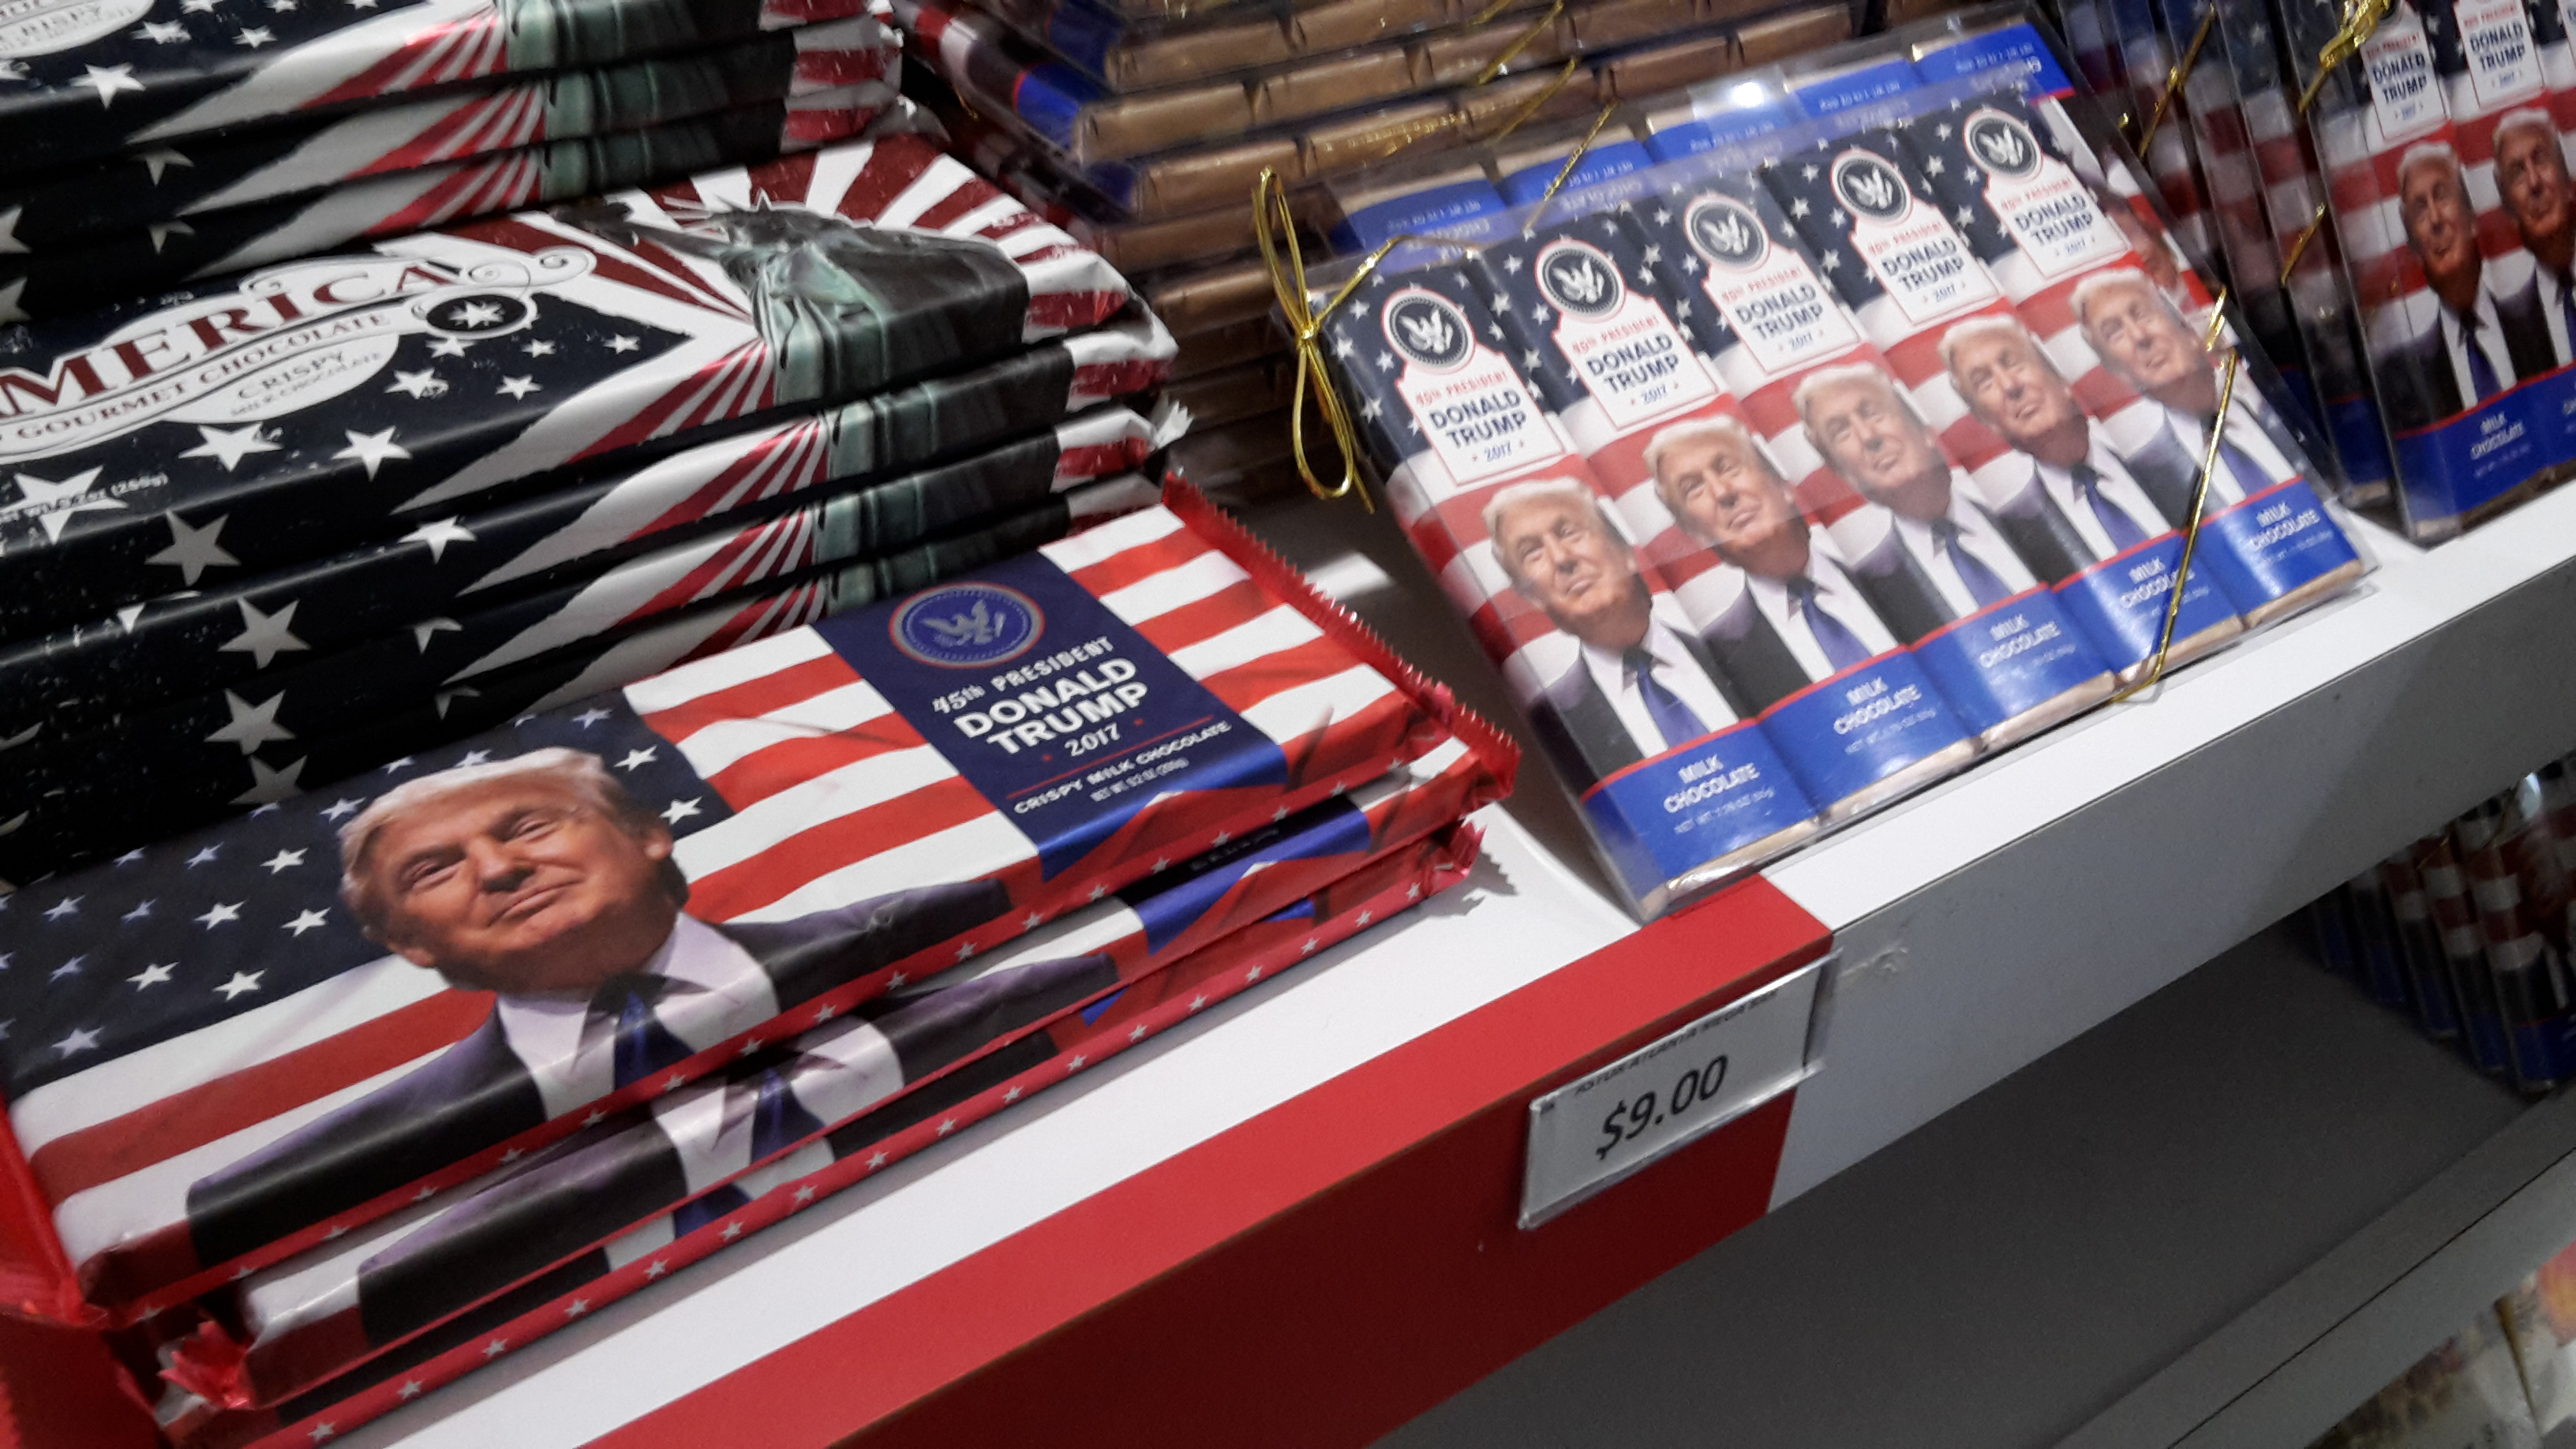
Luckily, I was not totally on my own in Atlanta. Because I also have supervisors and colleagues from Delft, we traveled together. With two of my colleagues, we boarded a direct flight to Atlanta on March 8th, 2018. The all-American man sitting two rows behind us was a little disappointed when we told him we were attending a conference (he might have expected something more exciting), but nonetheless told us to “not let them cowboys snatch you up!”.
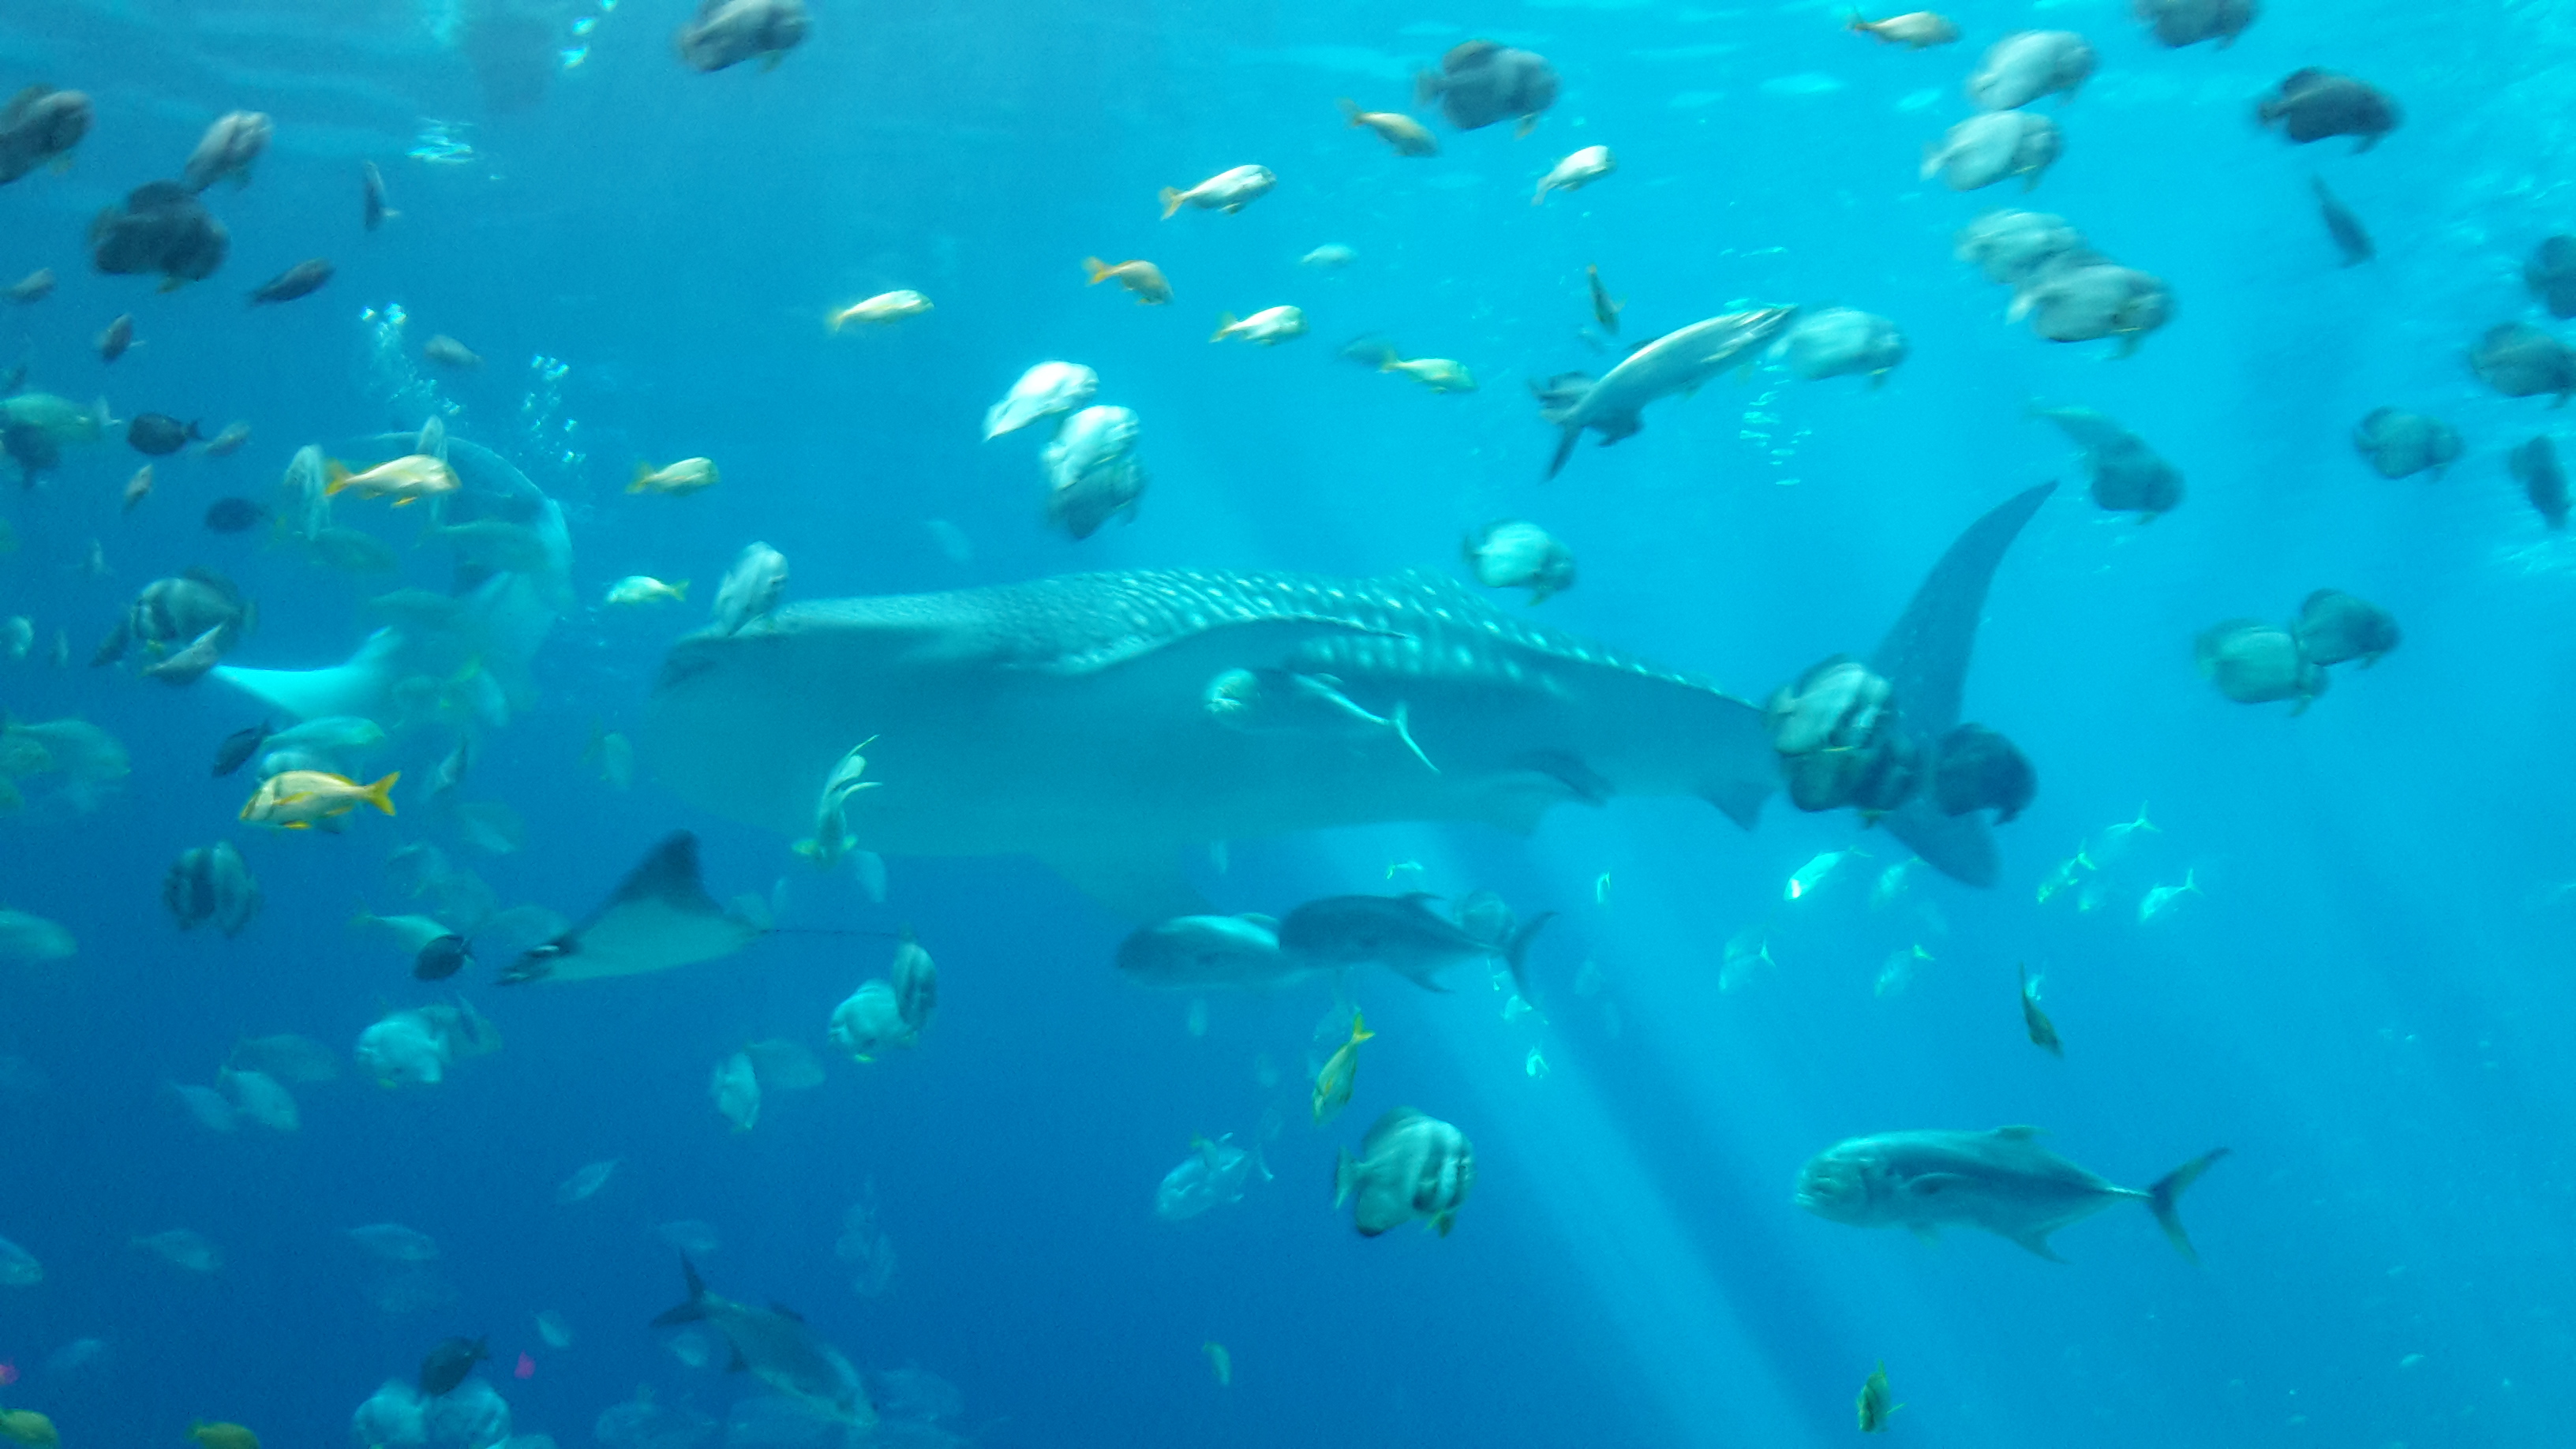
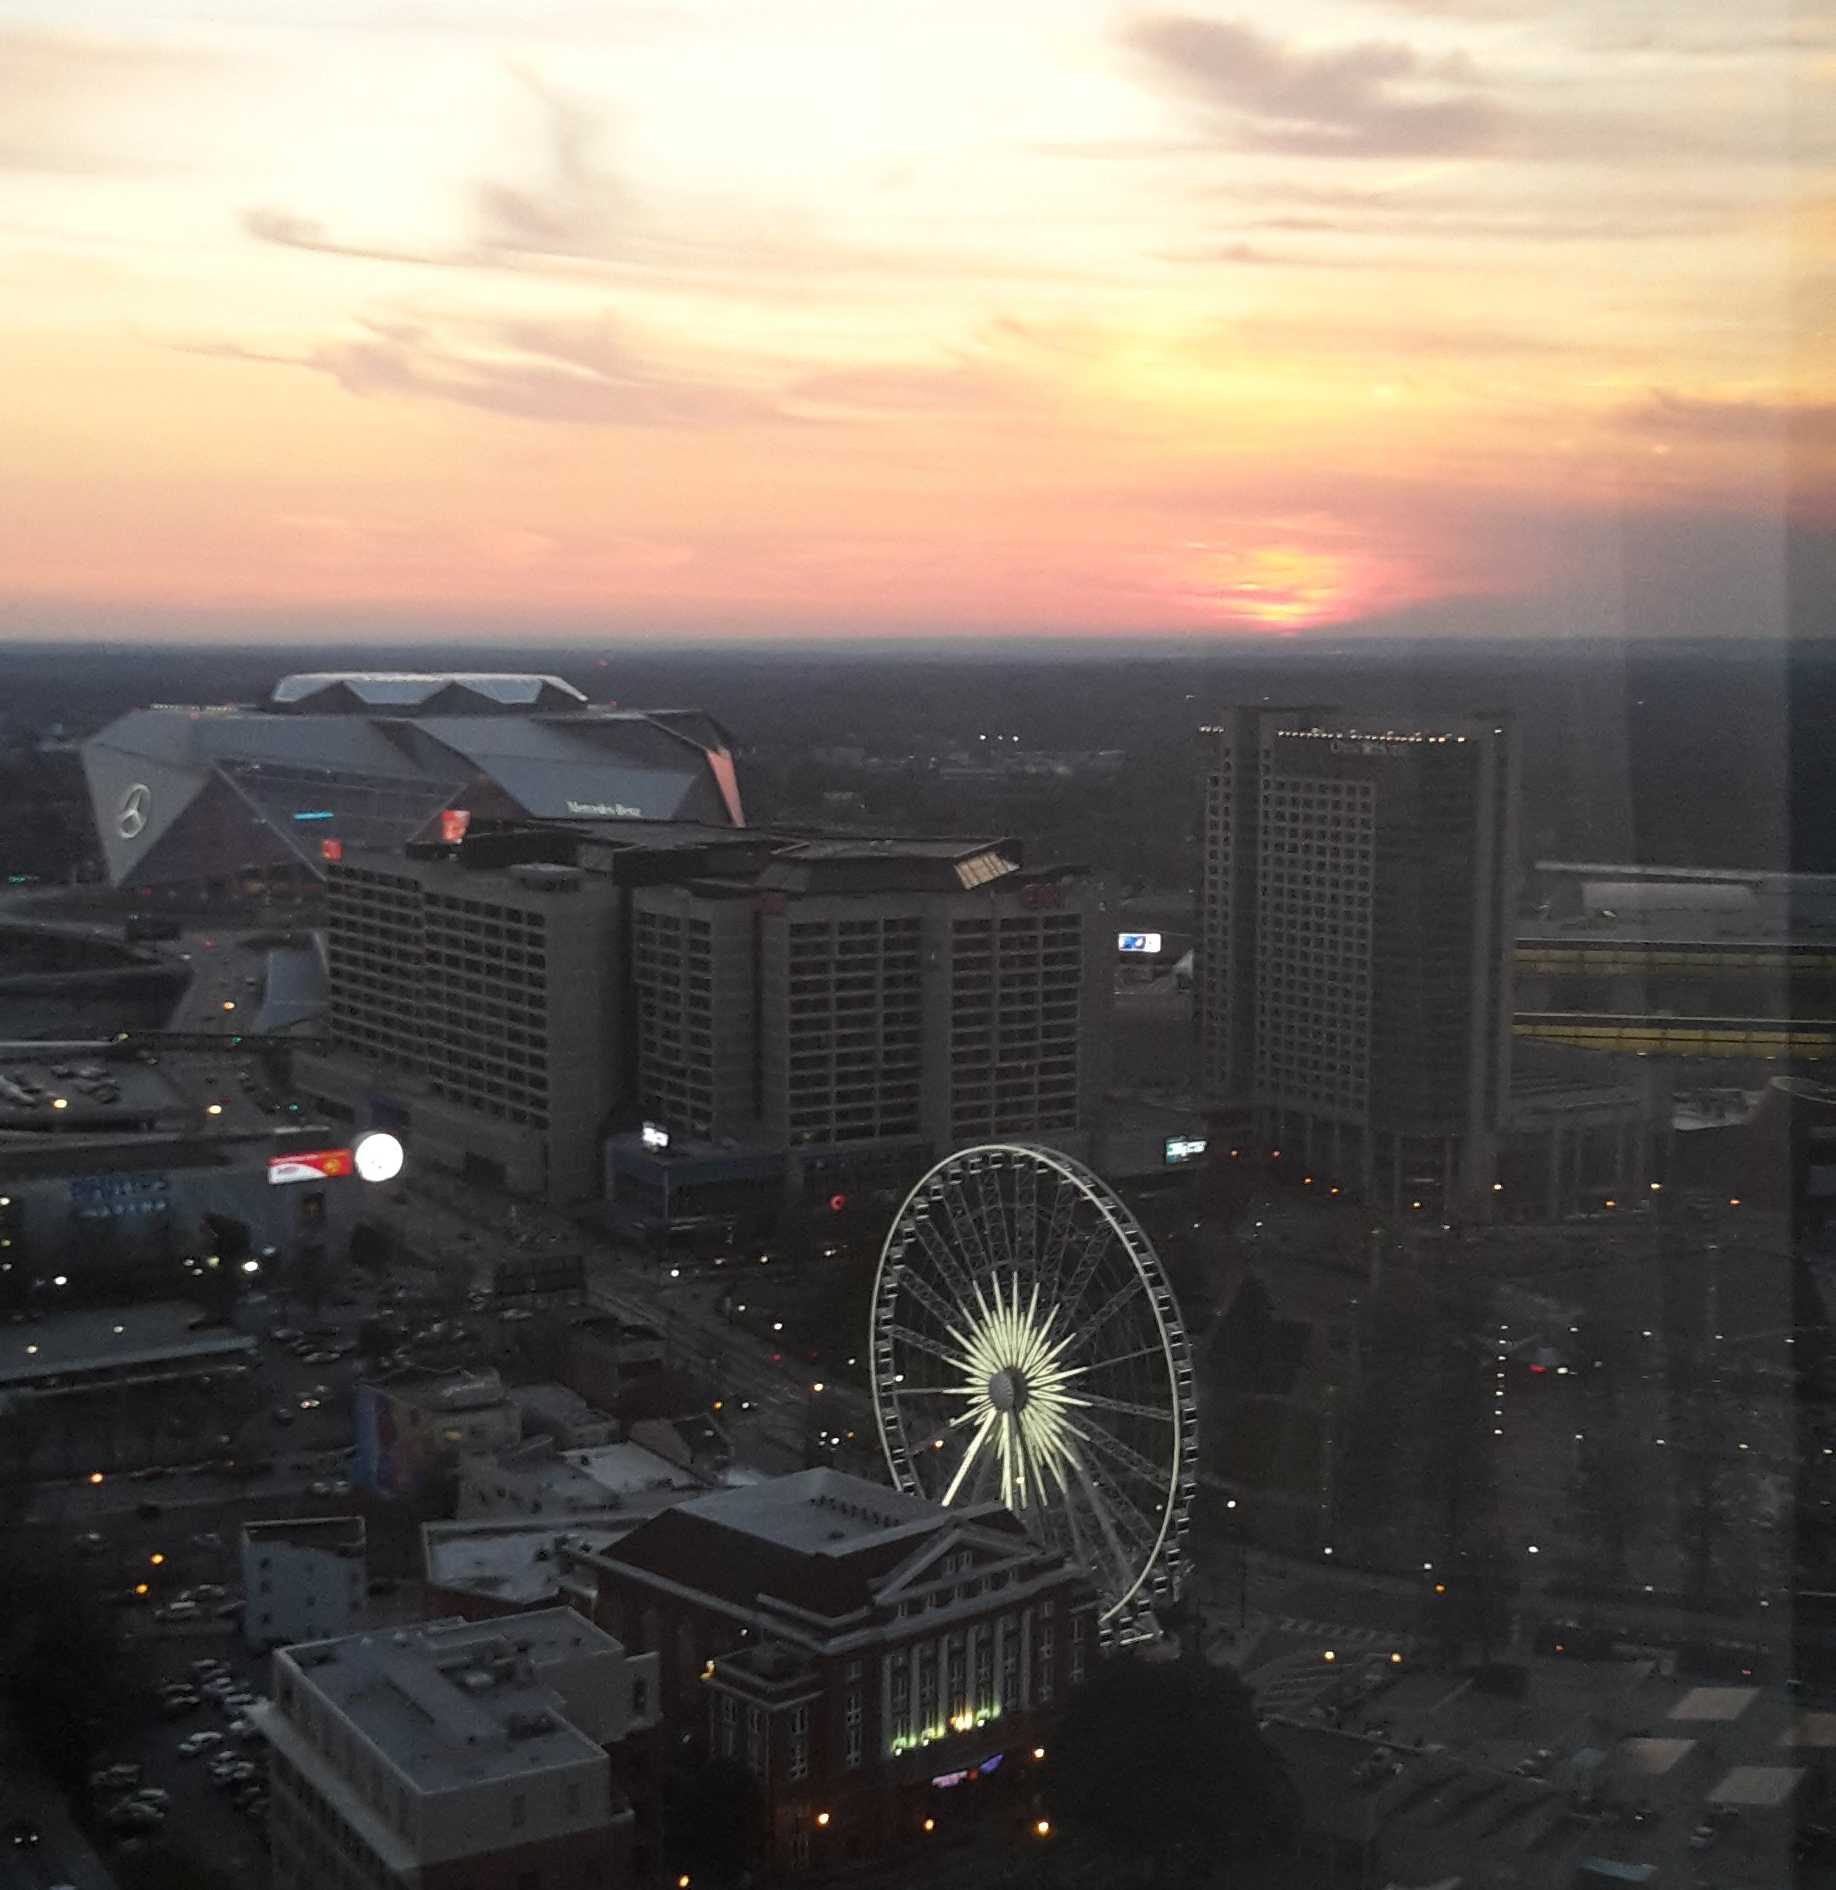
On our first day in Atlanta, the conference had not started and we did some sightseeing. Although Atlanta is known for many things (Martin Luther King, World of Coca Cola, Say Yes to the Dress, and according to Google the nicest tree-house AirBnB), we decided to go to the Georgia Aquarium, which has an almost 24-million-liter water tank hosting four giant whale sharks, several manta rays and loads of fish. Upon return to our hotel, we ironed our clothes and refined our presentations, as the next day, the conference would start.
I had a great time presenting my research in a symposium hosted by my promotor, Jan van Driel, and the three other presenters which I had already met once at the PCK summit. During the conference, there were a lot of presentations by PCK researchers, and it was very informative. Gradually, I met a lot of people who I formerly just knew from their names, which often appeared on my reference list (for example Tamara Moore, Selcen Guzey, Barbara Crawford, Kennedy Chan). If anyone wants more information on the presentations given at NARST, I’d be happy to inform you!
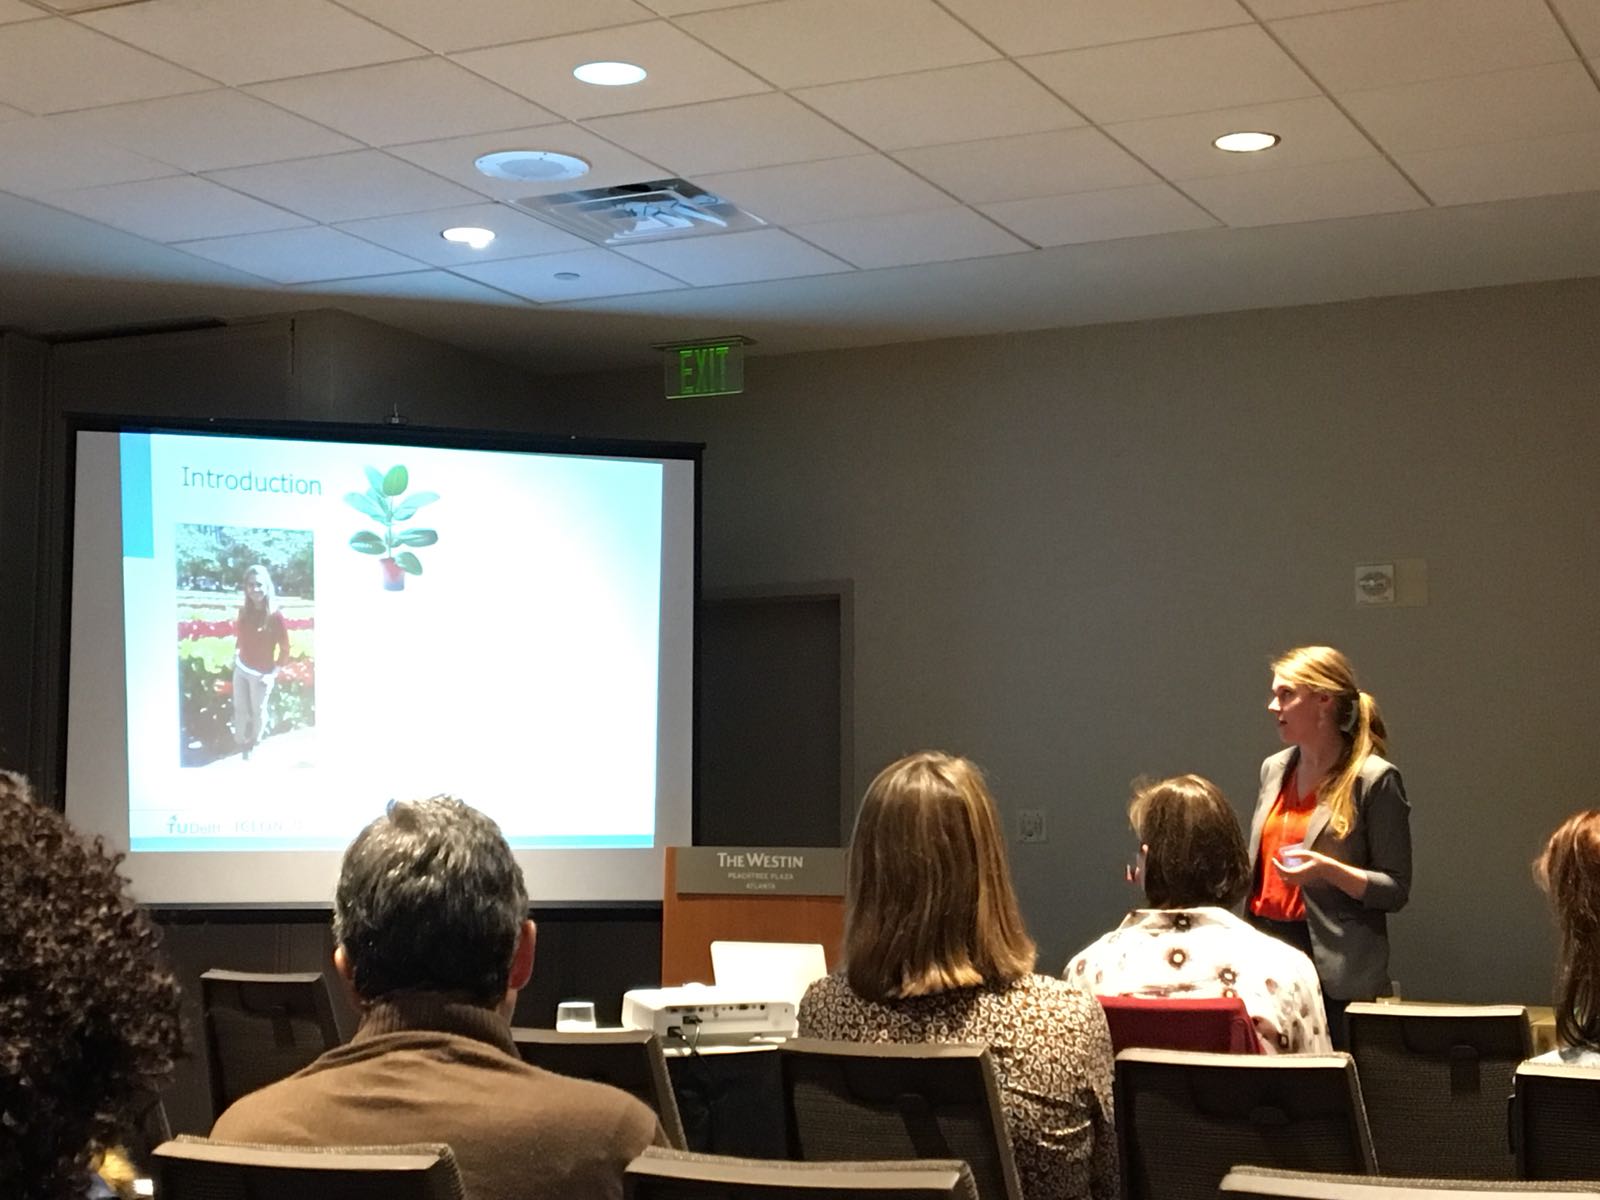
I study the integration of engineering design activities and research activities (or scientific inquiry, as most American researchers call it), and this was the first conference where there were so many presentations and sessions on this topic. I feel that this topic might be more prominently addressed in American education as the National Research Council and the Next Generation Science Standards have also placed emphasis on the combination of research and design in STEM. The Dutch subject O&O (Onderzoeken & Ontwerpen, the Dutch abbreviation for Research & Design) which forms the context of the study I presented, also gained a lot of interest among international researchers.
After four days of conference, and 6 days in Atlanta, I flew home feeling very content with such a productive conference. At this moment, I am still having email conversations with people I met there. It was my first time in the US and my first time at the NARST, and I can really recommend this conference if you’re working on science education as well!

Recent Comments