Post by Category : PHD

Conference season kick-off  1

The tallest building was our conference venue – not bad!


After a quiet wintertime, the conference season has officially started! As a researcher, you experience certain peak-times during the year, which are often related to… conferences. For example, in August we usually have to submit papers for international conferences. In January, we submit papers for national conferences held in summer. And just before the international conferences which usually start in April, we have to finish our analyses, write papers and prepare for meetings with our international colleagues who are sometimes our advisors, co-authors or make up our reference-list.

As a lot of ICLON researchers will attend AERA (American Educational Research Association) in New York this year, I will write this blog about a different conference which not so many ICLONners attended: the NARST (National Association for Research in Science Teaching) in Atlanta, US.

Luckily, I was not totally on my own in Atlanta. Because I also have supervisors and colleagues from Delft, we traveled together. With two of my colleagues, we boarded a direct flight to Atlanta on March 8th, 2018. The all-American man sitting two rows behind us was a little disappointed when we told him we were attending a conference (he might have expected something more exciting), but nonetheless told us to “not let them cowboys snatch you up!”.


Our view from Amsterdam to Atlanta.


On our first day in Atlanta, the conference had not started and we did some sightseeing. Although Atlanta is known for many things (Martin Luther King, World of Coca Cola, Say Yes to the Dress, and according to Google the nicest tree-house AirBnB), we decided to go to the Georgia Aquarium, which has an almost 24-million-liter water tank hosting four giant whale sharks, several manta rays and loads of fish. Upon return to our hotel, we ironed our clothes and refined our presentations, as the next day, the conference would start.


Breakfast at the Waffle House – not so healthy but a must-do for the all-American experience!


Whale sharks in the Georgia Aquarium.


I had a great time presenting my research in a symposium hosted by my promotor, Jan van Driel, and the three other presenters which I had already met once at the PCK summit. During the conference, there were a lot of presentations by PCK researchers, and it was very informative. Gradually, I met a lot of people who I formerly just knew from their names, which often appeared on my reference list (for example Tamara Moore, Selcen Guzey, Barbara Crawford, Kennedy Chan). If anyone wants more information on the presentations given at NARST, I’d be happy to inform you!


I held my presentation during the last session of the first day. Photo by Dury Bayram.


I study the integration of engineering design activities and research activities (or scientific inquiry, as most American researchers call it), and this was the first conference where there were so many presentations and sessions on this topic. I feel that this topic might be more prominently addressed in American education as the National Research Council and the Next Generation Science Standards have also placed emphasis on the combination of research and design in STEM. The Dutch subject O&O (Onderzoeken & Ontwerpen, the Dutch abbreviation for Research & Design) which forms the context of the study I presented, also gained a lot of interest among international researchers.


View over Atlanta.


After four days of conference, and 6 days in Atlanta, I flew home feeling very content with such a productive conference. At this moment, I am still having email conversations with people I met there. It was my first time in the US and my first time at the NARST, and I can really recommend this conference if you’re working on science education as well!


Anyone fancy a souvenir…?


First impressions as a visiting researcher in Victoria, Australia  1

Last week I was in Melbourne to join researchers from two different universities, namely the University of Melbourne and La Trobe University. An aim of my visit was to present my research findings and to learn about Higher Education and Medical Education in Victoria. Upon arriving in Melbourne I found I was in the right place to meet this goal, at least that’s been said on most license plates (‘Victoria – The education state).

The first thing I’ve learned is that student admission to Higher Education is quite different in Australia. In contrast to Dutch secondary education, there are no central school exams before going into university. Australian universities use students’ Australian Tertiary Admission Rank-score (ATAR), in which grades and subjects are combined to determine each student’s score. For example, if students get an ATAR of 80 it means that they outperform 80 per cent of students. Practically speaking, this might encourage students to choose their subjects strategically in order to be admitted to the best universities. In addition, admission requirements differ between universities which means that science, for instance, is not a required subject to study medicine. I don’t know yet what this means for students’ prior knowledge and how teaching staff goes about this when students start studying at university.

La Trobe University is a 50-year old university, a teaching-intensive university in the beginning although nowadays a research-intensive university. Students from the faculty of humanities are engaged in research in education in, for instance, the Hallmark program in their second undergraduate year. Within this program students conduct research projects in small groups with the duration of one year. The research projects are typically multidisciplinary, which provides challenges for the staff members supervising the projects, since they are used to research within their discipline. I was invited to present a study on fostering student learning in research supervision. This presentation was live at four other campuses through video streaming, which was quite an experience. Afterwards we’ve discussed how to enhance student learning in research within a limited amount of curriculum time. A different issue at La Trobe is students having difficulties understanding the English language. Students at La Trobe are from diverse cultural backgrounds, which has implications for promoting student learning.

The University of Melbourne is the oldest research-intensive university of Australia and I was invited to present at a research group meeting of the (bio)medical school. What I got from this is that the role of research in Medical Education isn’t as clear as we might think. So there is still some work to do (and this comment is useful for the introduction and discussion chapter of my thesis J ). It could be helpful to think about how research integration could prepare students for clinical work, building upon studies into other clinical roles (e.g., health advocate, communicator, scholar) as these roles are often not too appealing for students during education. Furthermore, we’ve discussed how to integrate research into undergraduate medical education. At the University of Melbourne there are generally no research activities in the undergraduate learning environment, except for the final year when students are expected to conduct an individual research project. This could hamper a positive student learning experience and learning outcomes.

The discussions in both universities might have implications for Higher Education as well as Medical Education. Our shared experiences indicate that further studies are needed to clarify what learning goals medical education aims for integrating research in teaching. Furthermore, our experiences illustrate that it is not that straigthforward to integrate research in learning activities in a way that promotes student learning.

Thanks to Hannah Schuerholz, Jan van Driel, David Clarke, Liz Malloy and all others being so generous with their time, comments and support. I had a great time in Melbourne. For the next two weeks I’ll be visiting Susan Howitt at the Australian National University in Canberra.


Boundary Crossing: for the Love of Research  0

crossing-a-lineLately, I have been occupied with the concept of boundary crossing. The first (and not the least) reason is, that within my own PhD, boundary crossing could provide me with a useful concept to look at the linkage between research and design activities in an educational context. The other, main reason is that my partner and I are literally boundary crossing (or actually, border crossing) at the moment, and the reason is: research. To be more specific, we are now crossing a physical boundary (called North Sea) as well as a symbolic boundary (Brexit), separating The Netherlands from the UK, since my partner moved to London for his first post-PhD postdoc job.

Boundary crossing is defined as “negotiating and combining ingredients from different contexts to achieve hybrid situations’’ (Engeström et al., 1995, p. 319). These boundaries can be crossed by people (called “brokers”), but also by objects (Akkerman & Bakker, 2011a). I think this theory might not only prove to be of use for my research, but also perfectly sums up my personal situation right now. We are combining ingredients from different situations (eg. living in The Netherlands and living in the UK) to achieve a hybrid situation in which my partner and I can still see each other and live with each other regularly, smoothly moving between these two countries.

However, we are still learning to be brokers, still learning how to optimally cross that boundary and facing difficulties while doing so. I think many researchers can identify with the challenges one faces while working and living abroad. It is very common to gain some research experience abroad while doing your PhD, this is also an activity very much encouraged here at ICLON.


If you have worked or lived abroad, what were your experiences? What things did you find helpful (or not)?

Below are some of my experiences:


  1. Be prepared for the idea. When you’re in research, especially certain fields of scientific research, research jobs are not so easy to get within a small country like The Netherlands. There might be far more opportunities in other countries. No one tells you this when you start an academic study, but I wish I had known when I was still studying Biology. It really was a surprise to me that staying in The Netherlands is not self-evident when choosing for certain research professions.
  2. Make good agreements with your partner/family. It is much easier to go overseas if you can see eye to eye with your loved ones, and not dragging along a reluctant partner. For example, we agreed to Skype every day (be sure to buy enough internet data for Skype! We made that mistake) and see each other every two weeks, while taking turns in flying to The Netherlands or the UK.
  3. Money issues. Be sure you have an adequate amount of saving money before moving to another country. This whole operation can be quite costly, if the company or university you are working for does not reimburse your flight or moving costs. We also had to spend some money on furniture in our London apartment, since we could not move whole closets to England by car (and Ikea in England is much more expensive!).
  4. Socializing. If you’re moving to work abroad, it is very important to get to know some people to build a social network while you’re there. This will make your stay much easier and much more pleasant. Get to know your colleagues, go to borrels, maybe join a club or sportsteam. This is of course also very important for the partner staying home 🙂
  5. Sightseeing. While you’re in another country, why not play the tourist for a few times and plan trips to go sightseeing. I have seen sides of London that I otherwise would never have seen, because of this move. And we are planning to see a lot more.


I hope, as I progress in the boundary crossing literature for my research, I will also become a more experienced broker myself in real life. And who knows, maybe in a few years it will be me crossing a boundary for research…?


telephone cell

plane


Airplane & telephone: boundary objects…?


Akkerman, S. F., & Bakker, A. (2011). Learning at the boundary: An introduction. International Journal of Educational Research, 50(1), 1-5.

Engeström, Y., Engeström, R., & Kärkkäinen, M. (1995). Polycontextuality and boundary crossing in expert cognition: Learning and problem solving in complex work activities. Learning and Instruction, 5, 319–336.

A guide to scientific skepticism  0

Don’t take my word for it, but being a scientist is about being a skeptic.

About not being happy with simple answers to complex problems.

About always asking more questions.

About not believing something merely because it seems plausible…

.. nor about reading a scientific study and believing its conclusions because, again, it all seems plausible.

“In some of my darker moments, I can persuade myself that all assertions in education:
(a) derive from no evidence whatsoever (adult learning theory),
(b) proceed despite contrary evidence (learning styles, self-assessment skills), or
(c) go far beyond what evidence exists.”
– Geoff Norman

Why you should be a skeptical scientist

The scientific literature is biased. Positive results are published widely, while negative and null results gather dust in file drawers (1, 2). This bias functions at many levels, from which papers are submitted to which papers are published (3, 4). This is one reason why p-hacking is (consciously or unconsciously) used to game the system (5). Furthermore, researchers often give a biased interpretation of one’s own results, use causal language when this isn’t warranted, and misleadingly cite others’ results (6, 7). Studies which have to adhere to a specific protocol, such as clinical trials, often deviate from the protocol by not reporting outcomes or silently adding new outcomes (8). Such changes are not random, but typically favor reporting positive effects and hiding negative ones (9). This is certainly not unique to clinical trials; published articles in general frequently include incorrectly reported statistics, with 35% including substantial errors which directly affect the conclusions (10-12). Meta-analyses from authors with industry involvement are massively published yet fail to report caveats (13). Besides, when the original studies are of low quality, a meta-analysis will not magically fix this (aka the ‘garbage in, garbage out’ principle).

Note that these issues are certainly not restricted to qualitative research or (semi-)positivistic paradigms, but are just as relevant for quantitative research from a more naturalistic perspective (14-16).

everybody lies

This list could go on for much longer, but the point has been made; everybody lies. Given the need to be skeptical, how should we read the scientific literature?


Using reflective reasoning to prevent bias

Reading is simple, but reading to become informed is much harder. This is especially the case when we are dealing with scientific theories. To aid you in this endeavor I will borrow the ‘reflective reasoning’ method from medical education. It has been proven that it There is some evidence that it enhances physicians’ clinical reasoning, increases diagnostic accuracy, and reduces bias (17-19).

Step One. Pick a theory. This can be your own theory, or any theory present in the academic literature. We will call this theory the diagnosis.

Step Two. Now list all the symptoms which are typical of this diagnosis. In other words: which data/studies support the theory? The key step is to differentiate between findings in the following manner:

  1. Which findings support the theory?
  2. Which findings contradict the theory?
  3. Which findings are expected given the theory, but are missing?

Why can this be helpful? Because by our nature we fixate on findings which confirm what we already believe (20). These questions can help reduce confirmation bias and give you a much more balanced perspective on the literature.

If you are not aware of any contradictory or missing evidence then take this as a sign that you might have been reading a biased section of the literature.

Step Three. In addition to the initial theory, list all alternative theories which could potentially explain the same array of findings and again list all the three types of findings, like this:


Theories Confirming findings Contradictory findings Findings which are expected, but missing
Theory A Findings 1-3 Findings 4-5 Findings 6-9
Theory B Findings 2-5 Finding 1 Findings 10-11
Theory C Findings 1-4 Findings 2-3, 5 Findings 6-11

Why is this step so important? Because most finding can be explained by multiple theories, just as any given symptom can be explained by multiple diagnoses. Should we only check whether a particular theory is supported by some data, than any theory would suffice because every theory has some support. In the above example, theory B and C both have the same level of supporting findings, but differ dramatically in the amount of contradictory and expected-but-missing findings.

It is a given that findings can differ in the quality of evidence they provide (from uninformative to very convincing) but also in their specificity; does a finding support only one theory, or does it fit in many models? If a theory is based mainly on findings which are also explained by other theories, it’s not a strong theory.

In the end, a theory is more than the sum of its supporting or contradicting findings. Nevertheless, carefully reflecting on the quantity and quality of evidence for any theory is an essential step for being a critical reader.


Why you should not be a skeptical scientist

No matter how critical or reflective you are, you will always remain biased. It’s human nature. That’s why you should not be a skeptical scientist by yourself.

Step Four. Invite others to take a very, very critical look at the theories you use and write about. In other words, ask others to be a ‘critical friend’. For a truly informative experience, invite them to be utterly brutal and criticize any and every aspect of whichever theory you hold dear, and then thank them for showing you how you lie a different perspective.

Luckily, there just happens to already exist an excellent platform where academics relentlessly criticize anything that is even remotely suspect. It’s called Twitter. Get on it. It’s fun and very informative.


More tips for the skeptical scientist

In addition to the reflective reasoning procedure, here are some more tips which can help you become a more critical, or skeptical, scientist. Do you have tips of your own? Please share!

  1. Play advocate of the devil: For every finding which is used to support a theory/claim, try to argue how it can be used to contradict it and/or support a different theory.
  2. Use these wonderful (online) tools to check: whether there is evidence for p-hacking (21), whether reported statistics such as p-values are correct (22 or 23), and whether reported Likert-scale summaries are plausible (24).
  3. Check the repeatability of a finding: For every finding, find at least one other study which reports the same finding using the same procedure and/or a different procedure. Likewise, actively search for contradicting findings.
  4. Doing a review or meta-analyses? Do all of the above, plus make funnel plots (25).
  5. Read the References section.
  6. Even if you’re not a fan, try pre-registration at least once.
  7. Use the free G*Power tool to post-hoc calculate the power of published studies, and use it to a-priori to plan your own studies (26).
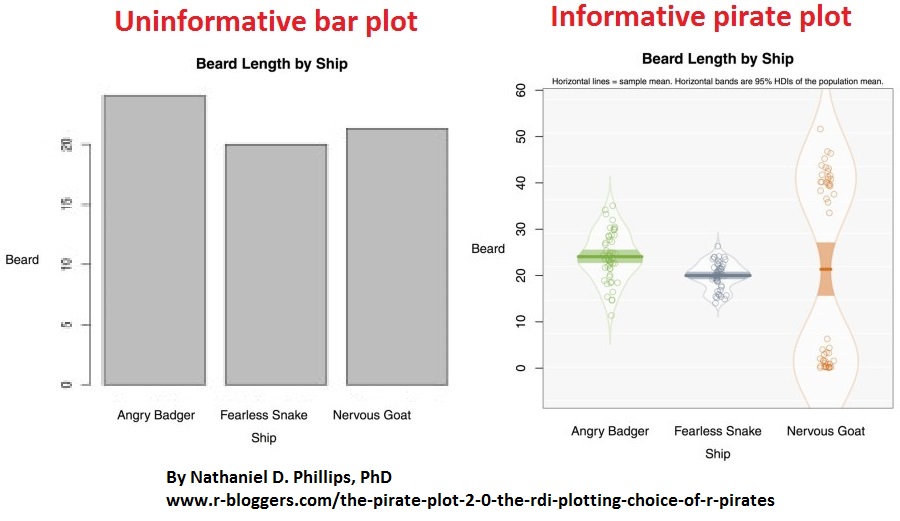
  8. When reporting empirical data, strive to visualize it in the most informative way. Bar plots are easily one of the least informative visualizations. Use more informative formats instead, such as the pirate plot in the image below (27).

pirate plot

References

  1. Dwan, K., Gamble, C., Williamson, P. R., & Kirkham, J. J. (2013). Systematic review of the empirical evidence of study publication bias and outcome reporting bias—an updated review. PloS one, 8(7).
  2. Franco, A., Malhotra, N., & Simonovits, G. (2014). Publication bias in the social sciences: Unlocking the file drawer. Science, 345(6203), 1502-1505.
  3. Coursol, A., & Wagner, E. E. (1986). Effect of positive findings on submission and acceptance rates: A note on meta-analysis bias.
  4. Kerr, S., Tolliver, J., & Petree, D. (1977). Manuscript characteristics which influence acceptance for management and social science journals. Academy of Management Journal, 20(1), 132-141.
  5. Head, M. L., Holman, L., Lanfear, R., Kahn, A. T., & Jennions, M. D. (2015). The extent and consequences of p-hacking in science. PLoS Biol, 13(3).
  6. Brown, A. W., Brown, M. M. B., & Allison, D. B. (2013). Belief beyond the evidence: using the proposed effect of breakfast on obesity to show 2 practices that distort scientific evidence. The American journal of clinical nutrition, 98(5), 1298-1308.
  7. Van der Zee, T. & Nonsense, B. S. (2016). It is easy to cite a random paper as support for anything. Journal of Misleading Citations, 33(2), 483-475.
  8. http://compare-trials.org/
  9. Jones, C. W., Keil, L. G., Holland, W. C., Caughey, M. C., & Platts-Mills, T. F. (2015). Comparison of registered and published outcomes in randomized controlled trials: a systematic review. BMC medicine, 13(1), 1.
  10. Bakker, M., & Wicherts, J. M. (2011). The (mis) reporting of statistical results in psychology journals. Behavior Research Methods, 43(3), 666-678.
  11. Nuijten, M. B., Hartgerink, C. H., van Assen, M. A., Epskamp, S., & Wicherts, J. M. (2015). The prevalence of statistical reporting errors in psychology (1985–2013). Behavior research methods, 1-22.
  12. Nonsense, B. S., & Van der Zee, T. (2015). The thirty-five percent is false, it is approximately fifteen percent. The Journal of False Statistics, 33(2), 417-424.
  13. Ebrahim, S., Bance, S., Athale, A., Malachowski, C., & Ioannidis, J. P. (2015). Meta-analyses with industry involvement are massively published and report no caveats for antidepressants. Journal of clinical epidemiology.
  14. Collier, D., & Mahoney, J. (1996). Insights and pitfalls: Selection bias in qualitative research. World Politics, 49(01), 56-91.
  15. Golafshani, N. (2003). Understanding reliability and validity in qualitative research. The qualitative report, 8(4), 597-606.
  16. Sandelowski, M. (1986). The problem of rigor in qualitative research. Advances in nursing science, 8(3), 27-37.
  17. Schmidt, H. G., van Gog, T., Schuit, S. C., Van den Berge, K., Van Daele, P. L., Bueving, H., … & Mamede, S. (2016). Do patients’ disruptive behaviours influence the accuracy of a doctor’s diagnosis? A randomised experiment. BMJ quality & safety.
  18. Mamede, S., Schmidt, H. G., & Penaforte, J. C. (2008). Effects of reflective practice on the accuracy of medical diagnoses. Medical education, 42(5), 468-475.
  19. Van der Zee, T. & Nonsense, B. S. (2016). Did you notice how I just cited myself; How do you know I am not just cherry-picking? Journal of Misleading Citations, 33(2), 497-484.
  20. Mynatt, C. R., Doherty, M. E., & Tweney, R. D. (1977). Confirmation bias in a simulated research environment: An experimental study of scientific inference. The quarterly journal of experimental psychology, 29(1), 85-95.
  21. http://p-curve.com/
  22. https://mbnuijten.com/statcheck/
  23. http://graphpad.com/quickcalcs/
  24. http://www.r-bloggers.com/how-to-check-likert-scale-summaries-for-plausibility/
  25. Duval, S., & Tweedie, R. (2000). Trim and fill: a simple funnel‐plot–based method of testing and adjusting for publication bias in meta‐analysis. Biometrics, 56(2), 455-463.
  26. http://www.gpower.hhu.de/en.html
  27. http://www.r-bloggers.com/the-pirate-plot-2-0-the-rdi-plotting-choice-of-r-pirates/

Doing a systematic review  2

One of my papers is going to be a systematic review, so for the past few weeks I have been busy searching and selecting articles. Of course I encountered some problems, because it would not be a PhD if everything went right the first time! Saskia thought it might be interesting if I share some of my experiences with you guys.


Search terms

So I don’t know about you guys, but the subject of my research has many synonyms. While I usually refer to my topic as being “intermediate assessment” other researchers have talked about frequent testing, continuous testing, or I don’t know how many other combinations. The problem with topics that have a lot of synonyms is that you can miss some very relevant articles, just because, for example, you only searched for testing and not for exams.

To avoid this I re-read some articles I have used in my research before to see what terms they used. Another smart strategy to define your search terms is looking for other reviews about the same subject and see which search terms they use. Of course if you do find other reviews, make sure that yours is an interesting addition!

After going through some articles I read before and thinking of common synonyms myself I decided on a list of six words that could all signify assessment and seven terms that could indicate some form of intermediateness.


Digital illustration of magnifying glass

Searching

So you’ve decided on search terms, now it is time to search! There are so many different search engines and I do not pretend to know them all, but I have used the ones that are most common in the field of educational science, which are ERIC, PsycINFO and Web  of Science. Your professor or librarian may know which are most suitable for your field.

Fun fact. When I asked Web of Science to search for a combination of my 13 search terms, it found almost FIVE.HUNDRED.THOUSAND. results. Even after refining by saying I only wanted articles related to education and educational research, there were still over 8800 relevant articles. As you can imagine this is too much to go through, so I decided to switch to search term pairs. This means I had to do several searches and for now I have only combined my seven adjectives with “assessment”. In the future I may expand my search into the other synonyms for assessment, but for now I’ve decided to go and see how many articles I can select from this.


Selecting

After running a search you are left with a long list of articles that you need to check for relevance. To make efficient use of your time this first check for selection is usually done based on the title and abstract of an article. Of course this is where you run into problems if titles and abstracts are not informative enough for you to make an informed decision. For these doubtful cases you may need to read the full article.

Furthermore, selecting is a human task, meaning that it is not totally objective. I supplied my daily supervisor with one list of search results and my criteria for selection to check my process. Whereas I selected 33 articles, he only selected 24 and of course he selected some articles that I didn’t and vice versa. So now we need to sit together and see why we chose such different articles.

If you’ve selected articles you need to download the full text for reading. Fortunately, I found 260 full text articles, out of 281 selected search results.


required-reading


Reading

After selecting the articles you can start reading and extracting the relevant information for your review. This is what I am starting to do today, so I cannot provide any tips or experiences yet, but maybe you guys have some top tips for me? For example how I am going to survive reading 260 articles in the coming months!!

PhD: Prepare for humdrum Drag?  0

Although many of my friends keep asking me “How do you do this [PhD]?!” (and I keep thinking: Doing what? I just started and I ‘still’ like it…), this post won’t be about self-discipline, self-management, self-reflection, multi-tasking, meta-cognition or another kind of a PhD students’ conditional characteristic.* I enjoyed reading my colleague’s blog on being a PhD student (https://researchblog.iclon.nl/planning-everything-reading-writing-still/) and I could probably write another ten pages about this topic. However, what I chose to share with you today are my experiences with working in an inter-university research project so far.

It has been only 4,5 months since I started my PhD at ICLON. My PhD track is, just like many other PhD tracks, comparable to a (lonely) life on a private island. However, what makes my project less lonely (or less independent), are the people involved in this project; stakeholders so to say. As your research develops, more and more people will get involved. Probably every PhD student will get to the point of receiving feedback from various people with different perspectives, different goals in mind, or at least different pathways leading towards a certain goal. The starting point of my research project is: 3 universities, 3 interdependent projects, and 9 interdependent researchers. Yes: N-i-n-e. I thought it would be nice to tell you a little bit about my who-what-were-when-dilemmas a.k.a. Prepare for humdrum Drag (PhD). Note (!!!): This is not a manual including Do’s and Don’ts but simply a description of my thoughts. It also isn’t a genuine portrayal of reality but rather an exaggerated sarcastic one.


  • WHO’s the lucky one? Collaboration. I find it an intriguing phenomena as its process is dependent upon so many different factors. Among others: Expectation management. The projects we’re working on is interdependent in the sense that we’re dependent on each other’s data. This is a good thing, from a sharing-interests-perspective, as a smooth collection of data is close to everyone’s heart. However, from a responsibility-perspective it’s a little bit more complicated. Who’s doing what, where, and when? In other words: Who feels responsible? Me. For everything. Duh, that’s why I’m a PhD student (did somebody say control freak?).


are-you-a-control-freak


  • WHAT are you talking about? Something can make perfect sense to me and make no sense to others at the same time. It has only been 4,5 months since I started and I already get the feeling of being a puzzled researcher in a world of my own. What I mean to say is; Research is a process in one’s head. Before concrete products appear (such as a theoretical framework, concrete measurement instruments, or even black on white results), we think, read, rethink, reread, etcetera. As a result, meetings so far exist of brain-storming, weighting pros and cons, reformulating ideas, etcetera. In other words, the challenge is to translate our personal thinking process of, let’s say four weeks, to a meeting of two hours (with 8 other researchers also having their own thoughts).


justin-bieber-what-do-you-mean

I finally got to understand Bieber


  • WHERE?  A picture can say a thousand words…


1

Where to save files & notes?  


2

Where to synchronize latest versions to?


  • WHEN: To mail or not to mail? I think this type of humdrum drag is comparable to the Dutch saying “He shot all his gunpowder” (Hij heeft al zijn kruit verschoten). On a normal working day several issues will cross your mind that you would like to discuss with others. Will you decide to wait and think about it yourself for a couple of hours or days more? Or will you mail your colleagues and ask for their input? In the latter case, be aware that 1) This may result in a day of mailing back and forth without actually moving forward (my personal record is 21 mails of 7 people within 2 hours on 1 specific topic), or 2) Your colleagues will be fed up with your e-mails and won’t respond to your e-mails a second time.


* I realize that, in the end, I actually did write about it…


A Pirate’s Treasure Trove  0

Last time, I was thrilled to announce that my data had arrived. Now, as I am looking though the piles and piles of questionnaires, new questions have risen in my mind:

  • Why would someone cut out squares from the pages of their questionnaire?
  • I said: “tick the boxes in black or blue pen”. Not: “tick them in red, orange, yellow, lightblue or barely visible pencil”!
  • Why do these kids leave so many questions unanswered? I didn’t put that question mark in for nothing!
  • Why does a significant portion of the student population think my picture on the announcement letter ought to have a beard?

But the most important thing I discovered was that not all students fill in the questionnaire seriously. Of course, that could have been expected, but naïve as I was, I thought  it wouldn’t be so bad. While scanning in the hardcopy questionnaires into the computer that can read the answers for me, I came across a group of 6 questionnaires that were all filled out in a zigzag pattern. Obviously, this had been a group of silly teenagers who were sitting together and had come up with the idea of transforming the questionnaire into a zigzag artwork. Unfortunately, I could not use these questionnaires anymore. From then on, before I scanned the questionnaires, I manually looked through all of them to discover any other potential jokers. While doing this, I also discovered some other nice (and some not so nice, and some even very rude) artworks of students on the questionnaires. I made a selection of the nice ones as a keepsake.20151217_143010

“Good luck with your research, stranger”. Well thank you, stranger!

20151218_151800


Nice hat!

20160122_103338


“This makes me cranky”

Collage


An assembly of some nice artworks.

20151119_163555


A Harry Potter-with-a-beard look and a mathematical problem.

20150917_153019


Some students thought I should be a pirate instead of a researcher. Time for a career swap?


It is a little like snail mail: students responded to my “letter”. Although not very extensive or polite sometimes, it was a peculiar and surprising form of communication. I have enjoyed looking for the most creative outbursts on the paper.

Which one is your favourite? And have you ever experienced students drawing on your questionnaire or picture – and if so, did they also think you were meant to be a pirate?

Until next time mateys, ARRR!

Pirate treasure


Well, this pirate is going to search for more treasures in her data!

Image source: blogs.disney.com

My Questionnaire Quest  0

Quest: a journey towards a goal, serves as a plot device and (frequently) as a symbol… In literature, the objects of quests require great exertion on the part of the hero, and the overcoming of many obstacles”.

From last December until now, I have been anxiously awaiting for mail in my mailbox here at ICLON. By the time it was Christmas, I was singing “All I want for Christmas, is maiiiiil”! Really, nothing could make me a happier PhD student than receiving a bunk of mail like this on my desk every week:

20151216_090120


Because, ladies and gentlemen, my first data have arrived! Finally tangible proof that my first year of work as a PhD student has paid off.

Constructing and distributing a questionnaire was somewhat more complicated than I thought. Here are some things you should think about:


  1. Constructing the questions. You cannot just ask whatever you fancy to ask, I discovered. You need to justify what you ask your participants, preferably supported by literature and/or by questionnaires already available covering your topic.
  2. Online or hardcopy’s by mail? That was a very relevant question, since I wanted to have about 2000 students filling in my questionnaire, an online survey would be so much easier for me. But it would also have such a small response rate… Also considering that my questionnaire took about 20 minutes to complete, I chose to send around my questionnaire in hardcopy. That way, students could fill it out in the lesson of the corresponding teacher, and be more likely to complete the survey.
  3. Recruit participants. In my case, I needed schools and teachers to commit to my research, ensuring their students and teachers would fill in my questionnaires. I already knew some teachers, but definitely not enough to cover my whole research population. So, I started asking around. With colleagues (do they have any contacts with schools that might be interested?), friends, acquaintances, institutions also interested in my research topic… And eventually, I even made a list of appropriate schools, looked up their telephone numbers and tried to call the specific teachers to explain them about my research and invite them to participate. Do not underestimate this step. It. Takes. Time.
  4. Logistics. After I printed and stapled over 2000 questionnaires (thank God for automatic staplers), they needed to get to the right persons in the right schools. And those right persons in the right schools should also be able to send the piles of paper back to the right person: me! I am so, so lucky to have gotten help from people in my department, and people from the post office (and occasionally my boyfriend, who helped in the stapling process). I had this whole administration of how many questionnaires should go to which school, how many for students (white coloured paper) and how many to teachers (orange coloured paper). I needed piles of envelopes with the right addresses, and also self-addressed envelopes in which the teachers could send the questionnaires back in the mail.
  5. Communication. It helps to be clear about the agreement you have with the corresponding teacher. Remind them in which classes the questionnaire has to be distributed. In general, remind them. And administer who returned how many questionnaires to you.


And then, everything needed to get back to me. I waited in such anxiety. At this moment, my response rates luckily seem very high, although one of my greatest fears also came true as some of the envelopes got lost in the mail. While still awaiting the very last envelopes to return, the scanning and analyses can begin…

What are your experiences when constructing and distributing a questionnaire? What were the obstacles you met, and do you have any tips and tricks for others? Please let me know in the comments below!

cartoon8


Image source: www.channel4learning.com

So, what did I learn from my six-week stay abroad?  0

As you all might have noticed, we went offline for a little while. As much fun as we have when blogging about our PhD-lives, we need ideas for interesting blogposts. So, we took a little break, allowing ourselves to have experiences we could later write about. And look, here we are, back with new blogposts :-).


This week, I am taking you with me in a flashback to my stay in Berkeley. The previous time I wrote, it was mainly about my preparations for and my first experiences in Berkeley. Now, I have been back for a little over two months, and will write about what useful knowledge and experiences I gained. Because even though I was there for ‘just’ six weeks, what I brought back will last me months! In this blogpost I will focus on two of those insights I’ve gained. Read more

Letting off STEAM  2

071506nanotechnology02.ai
Image source: www.ontariosciencecentre.ca


As an educational researcher, I focus on the bèta science subjects in secondary education. Internationally, these subjects are also often referred to as STEM: Science, Technology, Engineering and Mathematics. Some time ago, I heard the suggestion to add a letter to this formula: the A of Art.


This is food for thought. In my research, I tried to briefly determine what people thought that an engineer, or a designer needed. Among other characteristics, I heard that a lot of people associated these professions with being creative, and being able to build things. Also, when designing, you often go back to your previous steps and adjust your choices to optimize the result. Some people even mentioned they thought of a designer (or engineer) as an artist. These qualities are not only used by designers and engineers, but often also by artists. Qualities that are considered to be important in STEM, appear to be important in the arts as well (or vice versa!).


I think Arts and Sciences are a good match. For one, you can communicate science through art. I remember a conversation I recently had with my peers, about valorisation of our research and letting people know your results. Getting into the headlines of newspapers is hard. Why not use art to communicate scientific research? Art can be a great way of enhancing one’s experience with science, not only addressing their ratio, but also their emotions end feeling for aesthetics. And why not use art in science? A creative infographic could really light up your paper. Art is also valuable in science education: as a trained Biologist, I drew hundreds of plants, animals, cell structures… Drawing enhances the amount of detail in which you look at things, which ultimately leads to a greater understanding of that what you’re studying. Art, in terms of music, could help you better understand the scientific content of a message: for example in this Dutch DNA song I made with peers during a Science Communication course.


steam
Image source: adapted from www.studiostift.nl

Arts and sciences are combined during festivals, such as the Night of Art and Knowledge, which took place last month here in Leiden. The several activities present included music acts (with attention to the science of music), maths in comedy, arts inspired by astrophysics, science themed theatre and storytelling, and more. The next Night of Arts and Sciences is already in the planning. The theme of this year’s children’s book week in the Netherlands is related to science. I often consider children’s books also small pieces of art. They do not only communicate knowledge, they communicate feeling as well.


In my opinion, arts and sciences can enhance each other when combined. Please comment below if you know more ways in which they might enhance (or possibly hinder?) each other. Do you think there is a future for STEAM? Feel free to share your thoughts (and let off steam).wink-98461_640