Don’t take my word for it, but being a scientist is about being a skeptic.
About not being happy with simple answers to complex problems.
About always asking more questions.
About not believing something merely because it seems plausible…
.. nor about reading a scientific study and believing its conclusions because, again, it all seems plausible.
“In some of my darker moments, I can persuade myself that all assertions in education:(a) derive from no evidence whatsoever (adult learning theory),(b) proceed despite contrary evidence (learning styles, self-assessment skills), or(c) go far beyond what evidence exists.”– Geoff Norman
Why you should be a skeptical scientist
The scientific literature is biased. Positive results are published widely, while negative and null results gather dust in file drawers (1, 2). This bias functions at many levels, from which papers are submitted to which papers are published (3, 4). This is one reason why p-hacking is (consciously or unconsciously) used to game the system (5). Furthermore, researchers often give a biased interpretation of one’s own results, use causal language when this isn’t warranted, and misleadingly cite others’ results (6, 7). Studies which have to adhere to a specific protocol, such as clinical trials, often deviate from the protocol by not reporting outcomes or silently adding new outcomes (8). Such changes are not random, but typically favor reporting positive effects and hiding negative ones (9). This is certainly not unique to clinical trials; published articles in general frequently include incorrectly reported statistics, with 35% including substantial errors which directly affect the conclusions (10-12). Meta-analyses from authors with industry involvement are massively published yet fail to report caveats (13). Besides, when the original studies are of low quality, a meta-analysis will not magically fix this (aka the ‘garbage in, garbage out’ principle).
Note that these issues are certainly not restricted to qualitative research or (semi-)positivistic paradigms, but are just as relevant for quantitative research from a more naturalistic perspective (14-16).

This list could go on for much longer, but the point has been made; everybody lies. Given the need to be skeptical, how should we read the scientific literature?
Using reflective reasoning to prevent bias
Reading is simple, but reading to become informed is much harder. This is especially the case when we are dealing with scientific theories. To aid you in this endeavor I will borrow the ‘reflective reasoning’ method from medical education. It has been proven that it There is some evidence that it enhances physicians’ clinical reasoning, increases diagnostic accuracy, and reduces bias (17-19).
Step One. Pick a theory. This can be your own theory, or any theory present in the academic literature. We will call this theory the diagnosis.
Step Two. Now list all the symptoms which are typical of this diagnosis. In other words: which data/studies support the theory? The key step is to differentiate between findings in the following manner:
- Which findings support the theory?
- Which findings contradict the theory?
- Which findings are expected given the theory, but are missing?
Why can this be helpful? Because by our nature we fixate on findings which confirm what we already believe (20). These questions can help reduce confirmation bias and give you a much more balanced perspective on the literature.
If you are not aware of any contradictory or missing evidence then take this as a sign that you might have been reading a biased section of the literature.
Step Three. In addition to the initial theory, list all alternative theories which could potentially explain the same array of findings and again list all the three types of findings, like this:
| Theories | Confirming findings | Contradictory findings | Findings which are expected, but missing |
| Theory A | Findings 1-3 | Findings 4-5 | Findings 6-9 |
| Theory B | Findings 2-5 | Finding 1 | Findings 10-11 |
| Theory C | Findings 1-4 | Findings 2-3, 5 | Findings 6-11 |
Why is this step so important? Because most finding can be explained by multiple theories, just as any given symptom can be explained by multiple diagnoses. Should we only check whether a particular theory is supported by some data, than any theory would suffice because every theory has some support. In the above example, theory B and C both have the same level of supporting findings, but differ dramatically in the amount of contradictory and expected-but-missing findings.
It is a given that findings can differ in the quality of evidence they provide (from uninformative to very convincing) but also in their specificity; does a finding support only one theory, or does it fit in many models? If a theory is based mainly on findings which are also explained by other theories, it’s not a strong theory.
In the end, a theory is more than the sum of its supporting or contradicting findings. Nevertheless, carefully reflecting on the quantity and quality of evidence for any theory is an essential step for being a critical reader.
Why you should not be a skeptical scientist
No matter how critical or reflective you are, you will always remain biased. It’s human nature. That’s why you should not be a skeptical scientist by yourself.
Step Four. Invite others to take a very, very critical look at the theories you use and write about. In other words, ask others to be a ‘critical friend’. For a truly informative experience, invite them to be utterly brutal and criticize any and every aspect of whichever theory you hold dear, and then thank them for showing you how you lie a different perspective.
Luckily, there just happens to already exist an excellent platform where academics relentlessly criticize anything that is even remotely suspect. It’s called Twitter. Get on it. It’s fun and very informative.
More tips for the skeptical scientist
In addition to the reflective reasoning procedure, here are some more tips which can help you become a more critical, or skeptical, scientist. Do you have tips of your own? Please share!
- Play advocate of the devil: For every finding which is used to support a theory/claim, try to argue how it can be used to contradict it and/or support a different theory.
- Use these wonderful (online) tools to check: whether there is evidence for p-hacking (21), whether reported statistics such as p-values are correct (22 or 23), and whether reported Likert-scale summaries are plausible (24).
- Check the repeatability of a finding: For every finding, find at least one other study which reports the same finding using the same procedure and/or a different procedure. Likewise, actively search for contradicting findings.
- Doing a review or meta-analyses? Do all of the above, plus make funnel plots (25).
- Read the References section.
- Even if you’re not a fan, try pre-registration at least once.
- Use the free G*Power tool to post-hoc calculate the power of published studies, and use it to a-priori to plan your own studies (26).
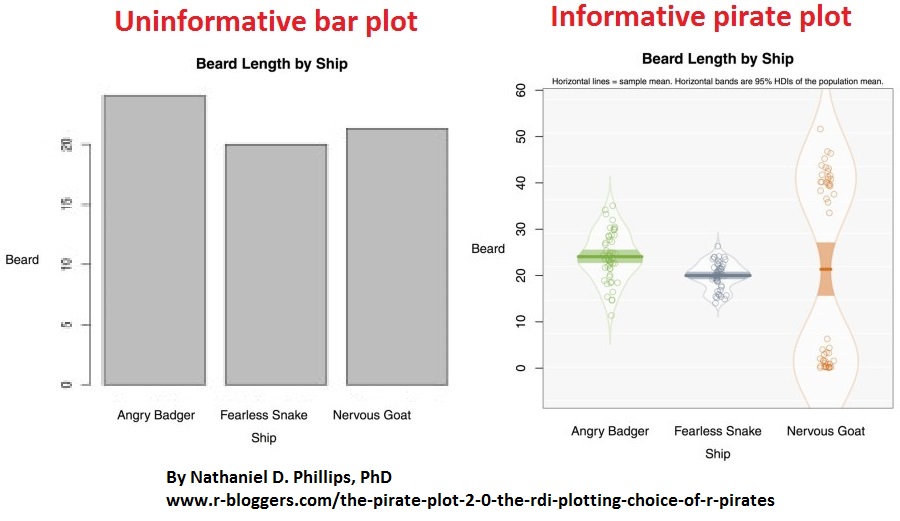
- When reporting empirical data, strive to visualize it in the most informative way. Bar plots are easily one of the least informative visualizations. Use more informative formats instead, such as the pirate plot in the image below (27).
References
- Dwan, K., Gamble, C., Williamson, P. R., & Kirkham, J. J. (2013). Systematic review of the empirical evidence of study publication bias and outcome reporting bias—an updated review. PloS one, 8(7).
- Franco, A., Malhotra, N., & Simonovits, G. (2014). Publication bias in the social sciences: Unlocking the file drawer. Science, 345(6203), 1502-1505.
- Coursol, A., & Wagner, E. E. (1986). Effect of positive findings on submission and acceptance rates: A note on meta-analysis bias.
- Kerr, S., Tolliver, J., & Petree, D. (1977). Manuscript characteristics which influence acceptance for management and social science journals. Academy of Management Journal, 20(1), 132-141.
- Head, M. L., Holman, L., Lanfear, R., Kahn, A. T., & Jennions, M. D. (2015). The extent and consequences of p-hacking in science. PLoS Biol, 13(3).
- Brown, A. W., Brown, M. M. B., & Allison, D. B. (2013). Belief beyond the evidence: using the proposed effect of breakfast on obesity to show 2 practices that distort scientific evidence. The American journal of clinical nutrition, 98(5), 1298-1308.
- Van der Zee, T. & Nonsense, B. S. (2016). It is easy to cite a random paper as support for anything. Journal of Misleading Citations, 33(2), 483-475.
- http://compare-trials.org/
- Jones, C. W., Keil, L. G., Holland, W. C., Caughey, M. C., & Platts-Mills, T. F. (2015). Comparison of registered and published outcomes in randomized controlled trials: a systematic review. BMC medicine, 13(1), 1.
- Bakker, M., & Wicherts, J. M. (2011). The (mis) reporting of statistical results in psychology journals. Behavior Research Methods, 43(3), 666-678.
- Nuijten, M. B., Hartgerink, C. H., van Assen, M. A., Epskamp, S., & Wicherts, J. M. (2015). The prevalence of statistical reporting errors in psychology (1985–2013). Behavior research methods, 1-22.
- Nonsense, B. S., & Van der Zee, T. (2015). The thirty-five percent is false, it is approximately fifteen percent. The Journal of False Statistics, 33(2), 417-424.
- Ebrahim, S., Bance, S., Athale, A., Malachowski, C., & Ioannidis, J. P. (2015). Meta-analyses with industry involvement are massively published and report no caveats for antidepressants. Journal of clinical epidemiology.
-
Collier, D., & Mahoney, J. (1996). Insights and pitfalls: Selection bias in qualitative research. World Politics, 49(01), 56-91.
-
Golafshani, N. (2003). Understanding reliability and validity in qualitative research. The qualitative report, 8(4), 597-606.
-
Sandelowski, M. (1986). The problem of rigor in qualitative research. Advances in nursing science, 8(3), 27-37.
- Schmidt, H. G., van Gog, T., Schuit, S. C., Van den Berge, K., Van Daele, P. L., Bueving, H., … & Mamede, S. (2016). Do patients’ disruptive behaviours influence the accuracy of a doctor’s diagnosis? A randomised experiment. BMJ quality & safety.
- Mamede, S., Schmidt, H. G., & Penaforte, J. C. (2008). Effects of reflective practice on the accuracy of medical diagnoses. Medical education, 42(5), 468-475.
- Van der Zee, T. & Nonsense, B. S. (2016). Did you notice how I just cited myself; How do you know I am not just cherry-picking? Journal of Misleading Citations, 33(2), 497-484.
- Mynatt, C. R., Doherty, M. E., & Tweney, R. D. (1977). Confirmation bias in a simulated research environment: An experimental study of scientific inference. The quarterly journal of experimental psychology, 29(1), 85-95.
- http://p-curve.com/
- https://mbnuijten.com/statcheck/
- http://graphpad.com/quickcalcs/
- http://www.r-bloggers.com/how-to-check-likert-scale-summaries-for-plausibility/
- Duval, S., & Tweedie, R. (2000). Trim and fill: a simple funnel‐plot–based method of testing and adjusting for publication bias in meta‐analysis. Biometrics, 56(2), 455-463.
- http://www.gpower.hhu.de/en.html
- http://www.r-bloggers.com/the-pirate-plot-2-0-the-rdi-plotting-choice-of-r-pirates/


Recent Comments