

Posts for Tag : SETs
AI-supported Formative Evaluation of Teaching 0
Mario de Jonge (ICLON) and Erwin Veenstra (LLInC)
Traditionally, the SET is one of the most widely employed instruments in higher education for evaluating the quality of teaching (e.g., Hendry & Dean, 2002; Hounsell, 2003). For a typical SET, after taking a course, students are asked to rate various aspects of the course (e.g., the clarity of the objectives, the usefulness of the materials, the methods of assessment) on a Likert scale. SET data is often the first and foremost source of information that individual teachers can use to evaluate both existing and new innovative teaching practices. SETs are often integrated in higher education professional development activities. For instance, at some faculties at Leiden university at Leiden University, SET results and their interpretation is an integral part of the University Teacher Qualification (a.k.a., BKO). Starting out teachers are expected to critically reflect in teaching portfolios on the results of SETs for the classes they have taught. Furthermore, the results of SETs can function as a source of information for teachers’ supervisors to guide discussions in yearly Performance and Development Interviews, sometimes leading to recommended or enforced future professional development activities for teachers.
However, for some time now, the SET has been subject to scrutiny for a variety of reasons. First, based on an up-to-date meta-analysis, the validity of SETs seems questionable. That is, there appears to be no apparent correlation between SET scores and student learning performance at the end of a course (Uttl, 2017). In fact, when learning performance is operationalized as the added value of a teacher to the later performance of students during subsequent courses (Kornell & Hausman, 2016), the relationship can even be inversed (i.e., teachers with lower SET scores appear to be of more added value). One explanation for this finding is that making a course more difficult and challenging can result in lower SET scores, presenting teachers with a perverse incentive to lower the bar for their students to obtain higher scores on a SET (Stroebe, 2020).
Second, the intensive and frequent use of SETs can lead to a form of “evaluation fatigue” among students (Hounsell, 2003), sometimes resulting in mindless and unreliable evaluations of teaching (e.g., Reynolds, 1977; Uijtdehaage & O’Neal, 2015). As a case in point, a classic article by Reynolds (1977) reported how a vast majority of students in a medical course chose to evaluate a lecture that had been cancelled, as well as a video that was no longer part of the course. In a rather ironic reflection on these results Reynolds concluded that:
“As students become sufficiently skilled in evaluating films and lectures without being there,… …, then there would be no need to wait until the end of the semester to fill out evaluations. They could be completed during the first week of class while the students are still fresh and alert.”
Third, the results of student evaluations of teaching can be severely biased (e.g., Neath, 1996; Heffernan, 2022). For instance, in a somewhat tongue-in-cheek review of the literature, Neath (1996) listed 20 tips for teachers to improve their evaluations without having to improve their actual teaching. The first tip on the list: Be male. Apparently, research suggests that, in general, male teachers receive higher ratings on SETs compared to female teachers. In a more recent review of the literature, Heffernan (2022) goes on to argue that SETs can be subject to racist, sexist and homophobic prejudices, and biased against discipline and subject area. Also, SETs that also allow for a qualitative response can sometimes illicit abusive comments most often directed towards women and teachers from marginalized groups. As such, SETs can be a cause of stress and anxiety for teachers rather than being an actual aid to their development.
Fourth, although studies often emphasize the importance of SETs for supporting and improving the quality of education, the underlying mechanism remains elusive (Harrison et al., 2022). It is unclear how SETs contribute to improving the quality of teaching. To the contrary, teachers can often find it challenging to decide what actual changes to make based on aggregated SET data that is largely quantitative in nature (Henry & Dean, 2010).
In short, the continued use of SETs for evaluating the quality of teaching in higher education is difficult to justify. The findings reported in the literature indicate that the validity and reliability of the SET are questionable, and the value for educational practice appears to be limited. One could argue that sticking with the SET is more a tradition than it is evidence-informed practice. Perhaps universities mostly persist in the routine in lack of an equally (cost-)efficient and scalable alternative. In this blog, we delineate the development and pilot of one possible alternative.
The FET. Late 2023, an Innovation Fund Proposal was awarded a small grant to develop an alternative approach for the evaluation of teaching. At the start of 2024, Mario de Jonge (researcher at ICLON), Boje Moers (project manager at LLInC), Anthea Aerts (educational consultant at LLInC), Erwin Veenstra, and Arian Kiandoost (developers/data analysts, LLInC) collaborated on the development and subsequent small-scale pilot of the FET (Formative Evaluation of Teaching).
The FET is designed to be more conducive for the improvement of teaching practices (formative, qualitative) and less focused on mere assessment of teaching (summative, quantitative). Like the traditional SET, the FET is fast, efficient and relatively inexpensive. However, the FET aims to give teachers clearer directions and qualitative input on how to improve their teaching.
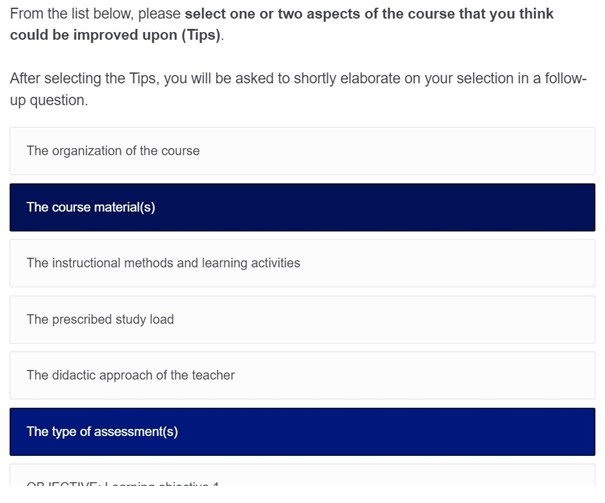
In the first step of the FET survey (Figure 1), students are presented with a list of course aspects on which they can give feedback. Some of the aspects on the list are general (e.g., the methods of assessment), while some of them can be course-specific (e.g., learning objectives). Note that the course aspect pertaining to the teacher specifically asks students to direct feedback on their didactic approach. As noted, students’ evaluations of teaching can sometimes be prone to unconstructive abusive comments. By explicitly asking students to focus on the didactic approach, we hope to discourage these type of undesirable and unconstructive comments.
From the list of aspects, students are asked to select just one or two key aspects which they appreciated (i.e., tops), and one or two key aspects which they think could be improved upon (i.e., tips). With this design feature, we hope counter the threat of evaluation fatigue that is more likely to occur in more comprehensive surveys like the traditional SET that require students to evaluate each and every aspect of a course.
In the second step (Figure 2), after selecting one or two aspects as tips and tops, students are asked to write a short motivation for their respective selections. This set-up allows students to share their insights in a fast, efficient, and meaningful way.
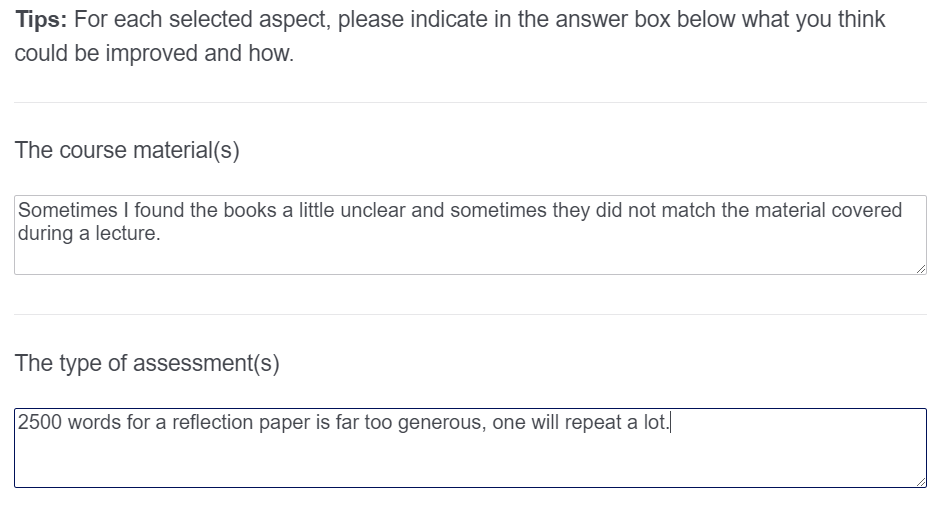
After a given course has been evaluated, the FET output provides teachers with a ranking of aspects that were selected most frequently. Because selected aspects have also been enriched with qualitative textual input from students, teachers can engage in a focused review of those student contributions that are most relevant for improving their course (i.e., comments on aspects that were selected most frequently).
Going over the FET evaluation results should be a relatively straightforward task for those who teach small classes. However, for teachers with larger classes we anticipated that this could be a considerable burden. This is where AI comes into play. LLInC developer Erwin Veenstra and data analyst Arian Kiandoost worked on a way of complementing the raw data with an AI-generated summary of the main results. Specifically, we wanted to select a Large Language Model (LLM) that was capable of performing the task of summarizing the data in such a way that it is easy to process and interpret. We expected that, with the current level of sophistication of available LLMs, it should be possible to generate a high-quality descriptive summary of the qualitative data. It took a fair amount of experimentation, iteration, and team discussion about different possible LLMs, output formats, and the “right” prompt before we arrived at a model and approach capable of performing the task.
The LLM we ended up using was OpenAI’s GPT-4 API (OpenAI Platform, n.d.). Note that, in contrast to the non-API consumer service ChatGPT, the OpenAI API does not have the same privacy and security issues. That is, data sent to the OpenAI API is not used to train or improve the model. Still, because we ended up using a cloud-based LLM, the data were first anonymized before feeding it to the LLM. Also, we rearranged the survey data into a JavaScript Object Notation (JSON) format (JSON, n.d.) to make it easier for the LLM to group information per course aspect. The LLM was prompted in such a way that it recognized comments were grouped per course aspect, and that differences in magnitude should also be expressed in the summary (i.e., one Tip versus 10 Tops should not carry the same weight). Furthermore, we prompted the LLM to generate one synthesized integrated summarization for the tips and tops per course aspect. We found that this way of reporting helped to make explicit and nuance apparent contradictions in the data (e.g., half of the students stating one thing, the other half stating the opposite). After the summary was generated, any omissions in the output due to anonymization would be transformed back into the original values in the final report.
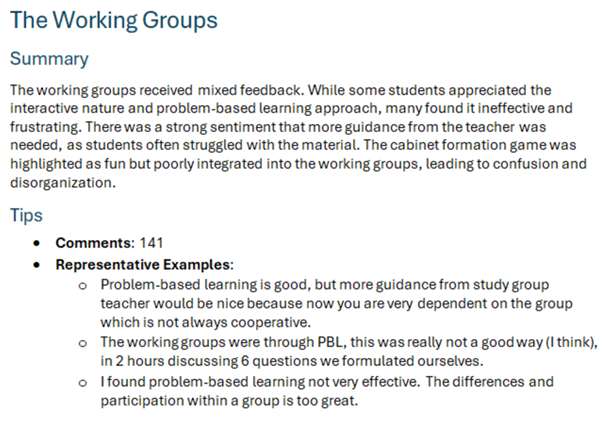
In the AI-generated summary, course aspects are presented in a descending order starting with the one that was selected most frequently. For each aspect, a short summary is generated to capture the overall gist of the student comments. Figure 3 shows a screenshot of an AI-generated summary and for one aspect, the working groups, of a course. Note that the summary only gives a descriptive synthesis of the students’ positive and negative, but the actual interpretation is left to the teacher. As is common knowledge, LLMs can sometimes be prone to “hallucinations”. We noticed that prompting the model to also provide an interpretation of the data, beyond what was in the text, increased the occurrence of hallucinations and also decreased the degree of reproducibility of the results. However, a simple more bare-bones LLM-generated descriptive summary provided what we felt was an accurate and reproducible representation of the data. To be sure, we prompted the LLM to supplement each summary with up to six “representative examples” (i.e., actual instances of student feedback) of tips and tops as a reference to the actual data. Furthermore, in the introduction text of to the AI-generated report, we encouraged teachers to cross-check with the actual raw data that was provided along with the summary, in case doubts would arise about the reliability.
In the past couple of months, the FET has been piloted in different contexts at Leiden University, ranging from small-group settings such as an elective master class course (+-20 students) to a large-group setting such as a BA course (200+ students). The feedback from the participating teachers has been overwhelmingly positive. All teachers indicated wanting to use the FET again in the future and in their interactions with us, they were able to give multiple concrete examples of changes they intended to make in future iterations of their course. Based on the large BA course, the median time it took students to fill out the survey was around 2 minutes and 40 seconds, a duration we consider not to be too much of a burden for the students. Compared to the regular SET survey from a previous cohort, the FET survey produced much more qualitive student feedback in terms of the total number of student comments. Furthermore, although the average word count per comment that not differ much between the SET and the FET, students filling out the FET clearly put more effort into comments specifically directed at improving the course (i.e. Tips). Most important, after receiving and discussing the report, the participating teacher indicated having a high-degree of confidence in the reliability of the AI-generated summary based on cross-checking with the raw data. In short, the preliminary results of our small scale pilot suggest that the FET can be a valuable tool for efficient collection of high-quality student feedback that is formative and more conducive to the improvement of teaching practices.
Outreach activities (workshops and presentations about the FET project) have now spiked the interest in the FET project within the university. In the next phase, we hope to get further support and funding to scale up the project and see if we can replicate our findings in a broader range of contexts and faculties. Also, for future direction, we aim to use an LLM that can be run on a local server (e.g., Mistral AI, n.d., Meta-Llama, n.d.). To run the larger versions of these kind of models, we need a more powerful computer than the one we had access to during the current project. However, such a machine has recently become available at LLInC.
As the project enters the next phase, we aim to investigate how the FET survey can be successfully implemented to improve educational design and how it can support teachers professional development activities. Furthermore, in our future endeavors we plan to also take into account the student perspective. This was outside the scope of the current project, but it is vital to consider the student perspective if the project is going to move forward and scale up.
Lastly, In the FET we purposefully chose to collect only qualitative data. As already noted abusive comments can sometimes enter into qualitative evaluation data and this can cause stress and anxiety among teachers. However, the qualitative evaluation data from our small-scale pilot did not seem to contain any student comments that could be considered abusive. Perhaps this was due to the design of the FET and the phrasing of the aspects in the list from which students could choose. Or perhaps it was simply due to the fact that students were aware that they were participating in a pilot project. However, even if abusive comments would enter into the FET, we expect that the LLM should be capable of filtering out such unconstructive comments. This is one thing that we would also want to test in the future (e.g., by contaminating evaluation data with a preconstructed set of abusive comments, and training the model to filter the data).
In conclusion, we believe the FET allows teachers to collect valuable feedback on the efficacy of their teaching in a fast, efficient, and meaningful way. Furthermore, the FET holds the potential for enhancing and enriching existing teacher professionalization activities as it can facilitate critical reflection on one’s own teaching practice.
References
Harrison, R., Meyer, L., Rawstorne, P., Razee, H., Chitkara, U., Mears, S., & Balasooriya, C. (2022). Evaluating and enhancing quality in higher education teaching practice: A meta-review. Studies in Higher Education, 47, 80-96.
Heffernan, T. (2022). Sexism, racism, prejudice, and bias: A literature review and synthesis of research surrounding student evaluations of courses and teaching. Assessment & Evaluation in Higher Education, 47, 144-154.
Hendry, G. D., & Dean, S. J. (2002). Accountability, evaluation of teaching and expertise in higher education. International Journal for Academic Development, 7, 75-82.
Hounsell, D. (2003). The evaluation of teaching. In A handbook for teaching and learning in higher education (pp. 188-199). Routledge.
JSON. (n.d.). https://www.json.org/json-en.html
Kornell, N., & Hausman, H. (2016). Do the best teachers get the best ratings?. Frontiers in psychology, 7, 570.
Meta-Llama. (n.d.). GitHub – meta-llama/llama3: The official Meta Llama 3 GitHub site. GitHub. https://github.com/meta-llama/llama3
Mistral AI. (n.d.). GitHub. https://github.com/mistralai/
Neath, I. (1996). How to improve your teaching evaluations without improving your teaching. Psychological Reports, 78, 1363-1372.
OpenAI Platform. (n.d.). https://platform.openai.com/docs/models
Reynolds, D. V. (1977). Students who haven’t seen a film on sexuality and communication prefer it to a lecture on the history of psychology they haven’t heard: Some implications for the university. Teaching of Psychology, 4, 82–83.
Stroebe, W. (2020). Student evaluations of teaching encourages poor teaching and contributes to grade inflation: A theoretical and empirical analysis. Basic and applied social psychology, 42, 276-294.
Uijtdehaage, S., & O’Neal, C. (2015). A curious case of the phantom professor: mindless teaching evaluations by medical students. Medical Education, 49, 928-932.
Uttl, B., White, C. A., & Gonzalez, D. W. (2017). Meta-analysis of faculty’s teaching effectiveness: Student evaluation of teaching ratings and student learning are not related. Studies in Educational Evaluation, 54, 22-42.
Podcast

Recent Comments