Do you use Cronbach’s alpha to check internal consistency? Don’t! Use Summability.  0

Do you sum questions of your exams to get final scores of students? Do you use a questionnaire with likert-scales? Do you analyze these questionnaires by taking the means of these questionnaire-items? Do you use the mean of questions in evaluation-forms? Do you average response times to items in experimental settings?


If you have answered yes to any of these questions, you may (or may not but should) have wondered whether the items in your questionnaire, exam, test, or experiment are (sort of) measuring the same thing, the construct you had intended to be measured. If so, it is more than likely that you have calculated Cronbach’s alpha and (if the value was over .7) happily reported that indeed, the items were internally consistent. If so, you have calculated and reported the wrong measure and you are not alone. Despite the fact that methodologists have shown numerous time that Cronbach’s alpha is not suitable for measuring internal consistency (see Sijtsma, 2009, for instance), in handbooks Cronbach’s alpha can still be found as the prime choice measure to be calculated. Because the intention of questionnaire and test constructers is to summarize the test by its overall sum score, Jelle Goeman (and myself) advocate summability, which is defined as the proportion of total “test” (questionnaire-subset, exam, evaluation) variation that is explained by the sum score.


Our paper recently came out in the journal Educational Measurement: Issues and Practice, in which we show summability to be a stable measure across a number of variables (including test or questionnaire length). From the few examples that have been calculated until now, and from insight in the mathematic formula, we can assume that a summability of .5 can be considered “high”. As yet, however, more experience has to be gained on summabilities of tests in various fields before definite recommendations can be given.


Therefore, I end this blog with a “Call for Calculations”: please go to (https://sites.google.com/view/summability) and calculate summability yourself, for an existing test, exam, questionnaire, or experiment. You can download the R-code from the website, or use the link to the shiny-app. All you need is a table with items as columns and participants as rows, filled with participants’ scores on the items, supposedly measuring your (one) construct. The table can be in plain text-format or it can be an SPSS-file. Report your scores through the form available on the website. In this way, we will be able to gain a fast accumulation of knowledge of what constitutes “high,” “moderate,” and “low” summabilities. Thank you!

Share This Post!Share on LinkedInTweet about this on TwitterShare on FacebookEmail this to someone

Denk na over onderzoek in de universitaire lerarenopleiding!  0

De universitaire lerarenopleidingen (ulo’s) liggen onder vuur. Dat is niet voor het eerst. De oorzaak voor dit terugkerende verschijnsel is dat het opleiden van docenten – net zoals onderwijs in het algemeen- simpel lijkt, maar het niet is. De meest recente discussie over kwaliteit van de ulo’s lijkt zich toe te spitsen op het onderzoek in de opleiding. Nu de postgraduate opleiding niet doorgaat – waarin geen onderzoek als eindwerk was opgenomen- staat het onderzoek in de masteropleiding weer onder druk. Het zou geen masterniveau hebben of kunnen hebben, is het verhaal. Nu is er zoals geschreven altijd discussie, maar het wordt menens wanneer beleidsmakers zich ermee bemoeien, en helemaal wanneer de politiek dat doet.

Waarom leren doen van onderzoek?

Deze gedachten worden gevoed door opvattingen wat onderzoek in een universitaire opleiding zou moeten zijn. Hierbij wordt het onderzoek vergeleken met de masterthese in een vakmaster, Onderwijsstudies of Pedagogiek. Maar deze masters zijn gericht op studenten die zich ontwikkelen tot wetenschappelijk onderzoeker in een bepaald domein. De ulo is een academische beroepsopleiding die studenten opleidt tot docenten die in staat zijn hun onderwijs te onderzoeken en op basis daarvan te verbeteren. Ofwel het primaire doel van het onderzoek in de ulo is niet het genereren van kennis, maar het verbeteren van de onderwijspraktijk.

Drie soorten kennis nodig

Wellicht kan het onderscheid van Cochran-Smith en Lytle (1999) in drie soorten kennis hierbij van dienst zijn. Het verwerven van deze drie soorten kennis speelt een cruciale rol in het leren van het beroep van docent:
Knowledge for practice – alle kennis en inzichten over schoolvakinhoud, leren en instructie, pedagogiek, etc. die is gebaseerd op wetenschappelijk onderzoek en theorievorming.
Knowledge in practice – alle kennis en inzichten over dezelfde onderwerpen, maar nu gebaseerd op praktijkervaringen en (kritische) reflecties op die praktijk.
Knowledge of practice – alle kennis en inzichten die zijn opgedaan door onderzoek naar de eigen onderwijspraktijk en die van collega’s, met als doel meer te weten te komen van een bepaalde praktijk, waarbij kennis uit wetenschappelijk onderzoek wordt toegepast en als spin-off ook wordt vermeerderd.

Knowledge for practice leren studenten in de cursusonderdelen die worden verzorgd in het opleidingsinstituut, knowledge in practice tijdens de begeleide praktijkervaringen in school en knowledge of practice in het onderzoek dat de studenten tijdens de opleiding doen. Hiermee vormt het onderzoek in de lerarenopleiding ook een natuurlijke brug tussen de inzichten die worden opgedaan op het opleidingsinstituut en de ervaringen in de schoolpraktijk als docent.

Hoe ziet dat onderzoek eruit?

Dat betekent dat het onderzoek van studenten in de lerarenopleiding is ingekaderd door inzichten die zijn verkregen door wetenschappelijk onderzoek en eerdere theorievorming, maar ingegeven door vragen die zij zelf hebben over hun onderwijspraktijk. Tevens moet het onderzoek zodanig zijn opgezet dat het informatie oplevert die studenten helpt bij hun onderwijspraktijk. Effectstudies met (quasi-)experimentele onderzoeksdesigns of grootschalig surveyonderzoek mogen in veel wetenschappelijk onderwijsonderzoek usance zijn, voor een docent-in-opleiding levert dergelijk onderzoek dikwijls weinig aanwijzingen op om de onderwijspraktijk te verbeteren. Probleemanalyse, actie-onderzoek of ontwerponderzoek leveren vaak wel de benodigde informatie op en doen niets af aan het masterniveau van het onderzoek. Integendeel, het lijkt simpel, maar dat is het niet.

Dus

Stop met onzinnige vergelijkingen en ga aan de slag met de specifieke eisen die het opleiden van docenten stelt.

Share This Post!Share on LinkedInTweet about this on TwitterShare on FacebookEmail this to someone

First impressions as a visiting researcher in Victoria, Australia  1

Last week I was in Melbourne to join researchers from two different universities, namely the University of Melbourne and La Trobe University. An aim of my visit was to present my research findings and to learn about Higher Education and Medical Education in Victoria. Upon arriving in Melbourne I found I was in the right place to meet this goal, at least that’s been said on most license plates (‘Victoria – The education state).

The first thing I’ve learned is that student admission to Higher Education is quite different in Australia. In contrast to Dutch secondary education, there are no central school exams before going into university. Australian universities use students’ Australian Tertiary Admission Rank-score (ATAR), in which grades and subjects are combined to determine each student’s score. For example, if students get an ATAR of 80 it means that they outperform 80 per cent of students. Practically speaking, this might encourage students to choose their subjects strategically in order to be admitted to the best universities. In addition, admission requirements differ between universities which means that science, for instance, is not a required subject to study medicine. I don’t know yet what this means for students’ prior knowledge and how teaching staff goes about this when students start studying at university.

La Trobe University is a 50-year old university, a teaching-intensive university in the beginning although nowadays a research-intensive university. Students from the faculty of humanities are engaged in research in education in, for instance, the Hallmark program in their second undergraduate year. Within this program students conduct research projects in small groups with the duration of one year. The research projects are typically multidisciplinary, which provides challenges for the staff members supervising the projects, since they are used to research within their discipline. I was invited to present a study on fostering student learning in research supervision. This presentation was live at four other campuses through video streaming, which was quite an experience. Afterwards we’ve discussed how to enhance student learning in research within a limited amount of curriculum time. A different issue at La Trobe is students having difficulties understanding the English language. Students at La Trobe are from diverse cultural backgrounds, which has implications for promoting student learning.

The University of Melbourne is the oldest research-intensive university of Australia and I was invited to present at a research group meeting of the (bio)medical school. What I got from this is that the role of research in Medical Education isn’t as clear as we might think. So there is still some work to do (and this comment is useful for the introduction and discussion chapter of my thesis J ). It could be helpful to think about how research integration could prepare students for clinical work, building upon studies into other clinical roles (e.g., health advocate, communicator, scholar) as these roles are often not too appealing for students during education. Furthermore, we’ve discussed how to integrate research into undergraduate medical education. At the University of Melbourne there are generally no research activities in the undergraduate learning environment, except for the final year when students are expected to conduct an individual research project. This could hamper a positive student learning experience and learning outcomes.

The discussions in both universities might have implications for Higher Education as well as Medical Education. Our shared experiences indicate that further studies are needed to clarify what learning goals medical education aims for integrating research in teaching. Furthermore, our experiences illustrate that it is not that straigthforward to integrate research in learning activities in a way that promotes student learning.

Thanks to Hannah Schuerholz, Jan van Driel, David Clarke, Liz Malloy and all others being so generous with their time, comments and support. I had a great time in Melbourne. For the next two weeks I’ll be visiting Susan Howitt at the Australian National University in Canberra.


Share This Post!Share on LinkedInTweet about this on TwitterShare on FacebookEmail this to someone

Erken leren in school ook in Lerarenregister!  5

Op 21 februari 2017 stemt de Eerste Kamer over het veelbesproken Lerarenregister. Het is bedoeld om de kwaliteit van het onderwijs te garanderen. Dat kan onder andere door van leraren te vragen hun bekwaamheid op orde te houden. Prima. Alleen: leraren worden in een mal gedrongen; een bredere aanpak kan veel meer voordelen opleveren.


Hoe zit het in elkaar?

In dit beroepsregister moeten leraren elke vier jaar aantonen dat zij hun bekwaamheid hebben onderhouden. Leraren mogen in hun register alleen professionaliseringsactiviteiten opnemen die worden verzorgd door geaccrediteerde instellingen. En daar wringt de schoen: dit zijn cursussen, workshops en opleidingen die buiten de school(muren) worden aangeboden. Ze zijn losgeknipt van de school zelf, de plek waar leraren functioneren. Professionalisering die door de school zelf wordt verzorgd, telt niet mee voor het register.

Dat is, zacht uitgedrukt, vreemd. Want uit de wetenschappelijke literatuur komt helder naar voren dat ‘leren op de werkplek’ niet alleen motiverend is voor leraren, maar zeker op lange termijn ook het meest effectief. Collegiale consultatie en observatie, peer coaching, leesgroepen, vakontwikkelgroepen, docentontwerpteams, professionele leergemeenschappen, kenniswerkplaatsen, en onderzoeksateliers: voorbeelden die van de werkplek (de school zelf dus) een echte leeromgeving voor leraren maken. Het geleerde wordt zo gemakkelijker toegepast in het werk en omgekeerd krijgt het werk van leraren een plek in hun leren en ontwikkelen. Een principe dat in het bedrijfsleven gemeengoed is; efficiënt en effectief, samenwerkingsgericht en gericht op kennisdelen. Scholen passen dit dan ook al toe. Ze investeren zo niet alleen in het professionaliseren van hun medewerkers, ze zorgen er tegelijkertijd voor dat de school zélf een duurzame professionele omgeving wordt. Het inhuren van extern, dus duur aanbod van buiten de school is minder effectief.


Voorbeelden

Drie concrete voorbeelden van scholen waarmee het ICLON samenwerkt. Van activiteiten die in het nieuwe Lerarenregister niet meer zouden meetellen. Zo heeft een school een aparte ‘academie’ ingericht waar workshops worden verzorgd door zowel leraren uit de school zélf als door buitenstaanders. Leesgroepen, boekenclubs en onderzoeksteams presenteren er hun bevindingen. Leraren die elders een workshop volgden, geven die kennis door, maar dan gekoppeld aan de specifieke eisen en wensen van de school. Voor het Lerarenregister telt dit niet.
Een andere school werkt met peer review door leraren: zij observeren elkaar tijdens het lesgeven, komen met opmerkingen en kritiek volgens een bepaald format en stellen hun onderwijs(methoden) op basis hiervan bij. Deelname aan zo’n peer review wordt door de school verplicht gesteld en is onderdeel van de beoordeling aan het eind van het jaar. Telt niet mee in het Lerarenregister.

In een derde school wordt in vaksecties gewerkt aan het ontwikkelen van het schoolvak, het ontwikkelen van materiaal en in onderzoek naar de werkzaamheid en toepasbaarheid van dat onderwijsmateriaal. Leren leraren een hoop van, wordt het onderwijs beter van, want direct toepasbaar in de eigen werkzaamheden. Maar telt niet mee.


Dus

Deze voorbeelden worden in meer scholen uitgevoerd. En er zijn meer voorbeelden te noemen. Ze dienen allemaal hetzelfde doel: maak het onderwijs en dus de school beter. Zeker als – en dat is een voorwaarde –activiteiten meerdere jaren meegaan. Het Lerarenregister en – daar ging het toch om? – de kwaliteit van de lessen gaat erop vooruit als dergelijke activiteiten in stand blijven. Een professionaliseringsbeleid dat medewerkers stimuleert, uitdaagt en laat leren met collega’s hoort dan ook binnen het register.

Share This Post!Share on LinkedInTweet about this on TwitterShare on FacebookEmail this to someone

Boundary Crossing: for the Love of Research  0

crossing-a-lineLately, I have been occupied with the concept of boundary crossing. The first (and not the least) reason is, that within my own PhD, boundary crossing could provide me with a useful concept to look at the linkage between research and design activities in an educational context. The other, main reason is that my partner and I are literally boundary crossing (or actually, border crossing) at the moment, and the reason is: research. To be more specific, we are now crossing a physical boundary (called North Sea) as well as a symbolic boundary (Brexit), separating The Netherlands from the UK, since my partner moved to London for his first post-PhD postdoc job.

Boundary crossing is defined as “negotiating and combining ingredients from different contexts to achieve hybrid situations’’ (Engeström et al., 1995, p. 319). These boundaries can be crossed by people (called “brokers”), but also by objects (Akkerman & Bakker, 2011a). I think this theory might not only prove to be of use for my research, but also perfectly sums up my personal situation right now. We are combining ingredients from different situations (eg. living in The Netherlands and living in the UK) to achieve a hybrid situation in which my partner and I can still see each other and live with each other regularly, smoothly moving between these two countries.

However, we are still learning to be brokers, still learning how to optimally cross that boundary and facing difficulties while doing so. I think many researchers can identify with the challenges one faces while working and living abroad. It is very common to gain some research experience abroad while doing your PhD, this is also an activity very much encouraged here at ICLON.


If you have worked or lived abroad, what were your experiences? What things did you find helpful (or not)?

Below are some of my experiences:


  1. Be prepared for the idea. When you’re in research, especially certain fields of scientific research, research jobs are not so easy to get within a small country like The Netherlands. There might be far more opportunities in other countries. No one tells you this when you start an academic study, but I wish I had known when I was still studying Biology. It really was a surprise to me that staying in The Netherlands is not self-evident when choosing for certain research professions.
  2. Make good agreements with your partner/family. It is much easier to go overseas if you can see eye to eye with your loved ones, and not dragging along a reluctant partner. For example, we agreed to Skype every day (be sure to buy enough internet data for Skype! We made that mistake) and see each other every two weeks, while taking turns in flying to The Netherlands or the UK.
  3. Money issues. Be sure you have an adequate amount of saving money before moving to another country. This whole operation can be quite costly, if the company or university you are working for does not reimburse your flight or moving costs. We also had to spend some money on furniture in our London apartment, since we could not move whole closets to England by car (and Ikea in England is much more expensive!).
  4. Socializing. If you’re moving to work abroad, it is very important to get to know some people to build a social network while you’re there. This will make your stay much easier and much more pleasant. Get to know your colleagues, go to borrels, maybe join a club or sportsteam. This is of course also very important for the partner staying home 🙂
  5. Sightseeing. While you’re in another country, why not play the tourist for a few times and plan trips to go sightseeing. I have seen sides of London that I otherwise would never have seen, because of this move. And we are planning to see a lot more.


I hope, as I progress in the boundary crossing literature for my research, I will also become a more experienced broker myself in real life. And who knows, maybe in a few years it will be me crossing a boundary for research…?


telephone cell

plane


Airplane & telephone: boundary objects…?


Akkerman, S. F., & Bakker, A. (2011). Learning at the boundary: An introduction. International Journal of Educational Research, 50(1), 1-5.

Engeström, Y., Engeström, R., & Kärkkäinen, M. (1995). Polycontextuality and boundary crossing in expert cognition: Learning and problem solving in complex work activities. Learning and Instruction, 5, 319–336.

Share This Post!Share on LinkedInTweet about this on TwitterShare on FacebookEmail this to someone

Small is beautiful: enjoy a national conference  0

The Onderwijs Research Dagen (ORD) took place in Rotterdam from Wednesday May 25th until Friday May 27th. I have made some progress towards graduation since the beginnings of my project in 2013 (time is flying!). I still feel that this national conference is a great learning experience for me as a PhD. Generally speaking, national conferences have some advantages for novice researchers in comparison with the larger ones abroad. Here’s why I’m enthusiastic about national conferences.


The very beginning: attend the preconference

The ORD (as other conferences) has preconference workshops tailored towards learning needs of PhD’s in Belgium and the Netherlands. Topics include academic writing, managing your supervisors, writing grant proposals and preparing your defense. I’ve visited similar sessions at international conferences as well. However, preconference workshops in a national conference pay specific attention to the Dutch and Flemish contexts, which directly apply to our educational context. Where else would you learn to avoid writing Dunglish with your peers?


Opportunities to close a gap with educational practice

Some might feel that educational research has a strong focus on theory. This may not always resonate with teaching experiences in practice. My experiences are that at a national conference you’ll meet more teachers, policy makers or educational managers than you would at a large conference. This means you could further discuss the practical relevance of your work. It also might help you to explore perspectives for your life after PhD.


Share the good stuff

When you’re designing your studies it can be very helpful to join a national conference, even without presenting. Chances are that presentations inspire you to use instruments and methods which are developed to suit the Dutch educational context. This makes it easy for you to join discussions during the conference, since you’re familiar with education in the Netherlands (sometimes I find it hard to immediately understand studies in foreign contexts) and to relate this to your own project. This could also provide opportunities to work together with colleagues relatively nearby.


Prevent yourself from being thrown in at the deep end

Besides a limited travel time to a national conference, it is nice to hear about topics being investigated in other institutes. This helped me, as a novice, to grasp the width of the field (here: higher education) without being overwhelmed by the amount of presentations. My studies are about research integrated into teaching at university which is also emphasized in Dutch universities of applied sciences. I’ve learned a lot about this at conferences as the ORD. Moreover, it is very likely that you’re able to go to a national conference annually within your PhD. This enables you to keep up with each other over a longer period of time.


For these reasons I would say that ‘the larger the party, the better’ has nothing to do with the number of people invited! Here you can read about Saskia’s experiences attending an international conference. Thank you for reading this blog!

Share This Post!Share on LinkedInTweet about this on TwitterShare on FacebookEmail this to someone

The story of ‘The PhD student and the Terrors of the Literature Review’.  0

There once was a PhD student – let’s call her Phyllis- working hard to land her research career. For that, she had to write a dissertation containing at least four studies. Her evil brain wanted her to not only conduct empirical studies, but also do a systematic literature review. At first, Phillis tried to find reasons for not doing it, because she dreaded that whole process. However, after a while she saw the greatness of the idea and took off to face the adventure. This adventure would not be a real adventure, had she not gotten into trouble several times. Read more

Share This Post!Share on LinkedInTweet about this on TwitterShare on FacebookEmail this to someone

A guide to scientific skepticism  0

Don’t take my word for it, but being a scientist is about being a skeptic.

About not being happy with simple answers to complex problems.

About always asking more questions.

About not believing something merely because it seems plausible…

.. nor about reading a scientific study and believing its conclusions because, again, it all seems plausible.

“In some of my darker moments, I can persuade myself that all assertions in education:
(a) derive from no evidence whatsoever (adult learning theory),
(b) proceed despite contrary evidence (learning styles, self-assessment skills), or
(c) go far beyond what evidence exists.”
– Geoff Norman

Why you should be a skeptical scientist

The scientific literature is biased. Positive results are published widely, while negative and null results gather dust in file drawers (1, 2). This bias functions at many levels, from which papers are submitted to which papers are published (3, 4). This is one reason why p-hacking is (consciously or unconsciously) used to game the system (5). Furthermore, researchers often give a biased interpretation of one’s own results, use causal language when this isn’t warranted, and misleadingly cite others’ results (6, 7). Studies which have to adhere to a specific protocol, such as clinical trials, often deviate from the protocol by not reporting outcomes or silently adding new outcomes (8). Such changes are not random, but typically favor reporting positive effects and hiding negative ones (9). This is certainly not unique to clinical trials; published articles in general frequently include incorrectly reported statistics, with 35% including substantial errors which directly affect the conclusions (10-12). Meta-analyses from authors with industry involvement are massively published yet fail to report caveats (13). Besides, when the original studies are of low quality, a meta-analysis will not magically fix this (aka the ‘garbage in, garbage out’ principle).

Note that these issues are certainly not restricted to qualitative research or (semi-)positivistic paradigms, but are just as relevant for quantitative research from a more naturalistic perspective (14-16).
everybody lies

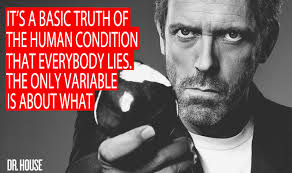
This list could go on for much longer, but the point has been made; everybody lies. Given the need to be skeptical, how should we read the scientific literature?


Using reflective reasoning to prevent bias

Reading is simple, but reading to become informed is much harder. This is especially the case when we are dealing with scientific theories. To aid you in this endeavor I will borrow the ‘reflective reasoning’ method from medical education. It has been proven that it There is some evidence that it enhances physicians’ clinical reasoning, increases diagnostic accuracy, and reduces bias (17-19).

Step One. Pick a theory. This can be your own theory, or any theory present in the academic literature. We will call this theory the diagnosis.

Step Two. Now list all the symptoms which are typical of this diagnosis. In other words: which data/studies support the theory? The key step is to differentiate between findings in the following manner:

  1. Which findings support the theory?
  2. Which findings contradict the theory?
  3. Which findings are expected given the theory, but are missing?

Why can this be helpful? Because by our nature we fixate on findings which confirm what we already believe (20). These questions can help reduce confirmation bias and give you a much more balanced perspective on the literature.

If you are not aware of any contradictory or missing evidence then take this as a sign that you might have been reading a biased section of the literature.

Step Three. In addition to the initial theory, list all alternative theories which could potentially explain the same array of findings and again list all the three types of findings, like this:


Theories Confirming findings Contradictory findings Findings which are expected, but missing
Theory A Findings 1-3 Findings 4-5 Findings 6-9
Theory B Findings 2-5 Finding 1 Findings 10-11
Theory C Findings 1-4 Findings 2-3, 5 Findings 6-11

Why is this step so important? Because most finding can be explained by multiple theories, just as any given symptom can be explained by multiple diagnoses. Should we only check whether a particular theory is supported by some data, than any theory would suffice because every theory has some support. In the above example, theory B and C both have the same level of supporting findings, but differ dramatically in the amount of contradictory and expected-but-missing findings.

It is a given that findings can differ in the quality of evidence they provide (from uninformative to very convincing) but also in their specificity; does a finding support only one theory, or does it fit in many models? If a theory is based mainly on findings which are also explained by other theories, it’s not a strong theory.

In the end, a theory is more than the sum of its supporting or contradicting findings. Nevertheless, carefully reflecting on the quantity and quality of evidence for any theory is an essential step for being a critical reader.


Why you should not be a skeptical scientist

No matter how critical or reflective you are, you will always remain biased. It’s human nature. That’s why you should not be a skeptical scientist by yourself.

Step Four. Invite others to take a very, very critical look at the theories you use and write about. In other words, ask others to be a ‘critical friend’. For a truly informative experience, invite them to be utterly brutal and criticize any and every aspect of whichever theory you hold dear, and then thank them for showing you how you lie a different perspective.

Luckily, there just happens to already exist an excellent platform where academics relentlessly criticize anything that is even remotely suspect. It’s called Twitter. Get on it. It’s fun and very informative.


More tips for the skeptical scientist

In addition to the reflective reasoning procedure, here are some more tips which can help you become a more critical, or skeptical, scientist. Do you have tips of your own? Please share!

  1. Play advocate of the devil: For every finding which is used to support a theory/claim, try to argue how it can be used to contradict it and/or support a different theory.
  2. Use these wonderful (online) tools to check: whether there is evidence for p-hacking (21), whether reported statistics such as p-values are correct (22 or 23), and whether reported Likert-scale summaries are plausible (24).
  3. Check the repeatability of a finding: For every finding, find at least one other study which reports the same finding using the same procedure and/or a different procedure. Likewise, actively search for contradicting findings.
  4. Doing a review or meta-analyses? Do all of the above, plus make funnel plots (25).
  5. Read the References section.
  6. Even if you’re not a fan, try pre-registration at least once.
  7. Use the free G*Power tool to post-hoc calculate the power of published studies, and use it to a-priori to plan your own studies (26).
  8. When reporting empirical data, strive to visualize it in the most informative way. Bar plots are easily one of the least informative visualizations. Use more informative formats instead, such as the pirate plot in the image below (27).
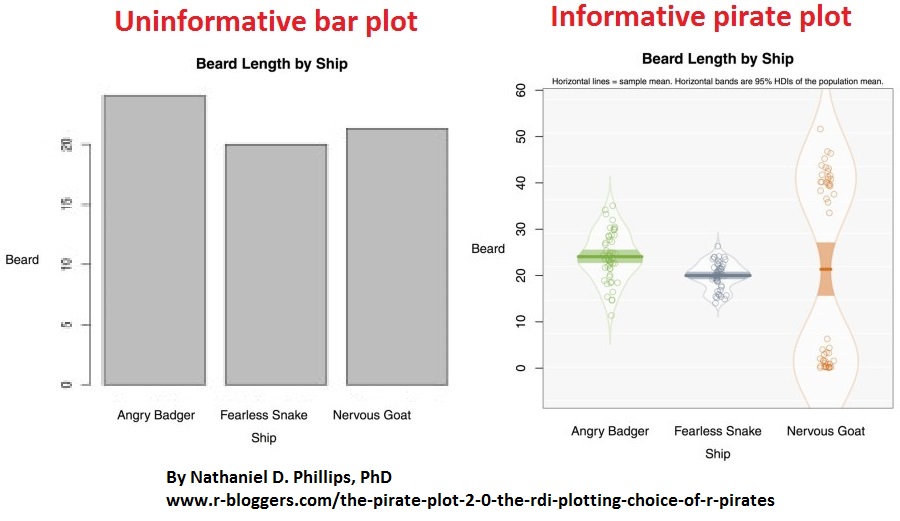
pirate plot

References

  1. Dwan, K., Gamble, C., Williamson, P. R., & Kirkham, J. J. (2013). Systematic review of the empirical evidence of study publication bias and outcome reporting bias—an updated review. PloS one, 8(7).
  2. Franco, A., Malhotra, N., & Simonovits, G. (2014). Publication bias in the social sciences: Unlocking the file drawer. Science, 345(6203), 1502-1505.
  3. Coursol, A., & Wagner, E. E. (1986). Effect of positive findings on submission and acceptance rates: A note on meta-analysis bias.
  4. Kerr, S., Tolliver, J., & Petree, D. (1977). Manuscript characteristics which influence acceptance for management and social science journals. Academy of Management Journal, 20(1), 132-141.
  5. Head, M. L., Holman, L., Lanfear, R., Kahn, A. T., & Jennions, M. D. (2015). The extent and consequences of p-hacking in science. PLoS Biol, 13(3).
  6. Brown, A. W., Brown, M. M. B., & Allison, D. B. (2013). Belief beyond the evidence: using the proposed effect of breakfast on obesity to show 2 practices that distort scientific evidence. The American journal of clinical nutrition, 98(5), 1298-1308.
  7. Van der Zee, T. & Nonsense, B. S. (2016). It is easy to cite a random paper as support for anything. Journal of Misleading Citations, 33(2), 483-475.
  8. http://compare-trials.org/
  9. Jones, C. W., Keil, L. G., Holland, W. C., Caughey, M. C., & Platts-Mills, T. F. (2015). Comparison of registered and published outcomes in randomized controlled trials: a systematic review. BMC medicine, 13(1), 1.
  10. Bakker, M., & Wicherts, J. M. (2011). The (mis) reporting of statistical results in psychology journals. Behavior Research Methods, 43(3), 666-678.
  11. Nuijten, M. B., Hartgerink, C. H., van Assen, M. A., Epskamp, S., & Wicherts, J. M. (2015). The prevalence of statistical reporting errors in psychology (1985–2013). Behavior research methods, 1-22.
  12. Nonsense, B. S., & Van der Zee, T. (2015). The thirty-five percent is false, it is approximately fifteen percent. The Journal of False Statistics, 33(2), 417-424.
  13. Ebrahim, S., Bance, S., Athale, A., Malachowski, C., & Ioannidis, J. P. (2015). Meta-analyses with industry involvement are massively published and report no caveats for antidepressants. Journal of clinical epidemiology.
  14. Collier, D., & Mahoney, J. (1996). Insights and pitfalls: Selection bias in qualitative research. World Politics, 49(01), 56-91.
  15. Golafshani, N. (2003). Understanding reliability and validity in qualitative research. The qualitative report, 8(4), 597-606.
  16. Sandelowski, M. (1986). The problem of rigor in qualitative research. Advances in nursing science, 8(3), 27-37.
  17. Schmidt, H. G., van Gog, T., Schuit, S. C., Van den Berge, K., Van Daele, P. L., Bueving, H., … & Mamede, S. (2016). Do patients’ disruptive behaviours influence the accuracy of a doctor’s diagnosis? A randomised experiment. BMJ quality & safety.
  18. Mamede, S., Schmidt, H. G., & Penaforte, J. C. (2008). Effects of reflective practice on the accuracy of medical diagnoses. Medical education, 42(5), 468-475.
  19. Van der Zee, T. & Nonsense, B. S. (2016). Did you notice how I just cited myself; How do you know I am not just cherry-picking? Journal of Misleading Citations, 33(2), 497-484.
  20. Mynatt, C. R., Doherty, M. E., & Tweney, R. D. (1977). Confirmation bias in a simulated research environment: An experimental study of scientific inference. The quarterly journal of experimental psychology, 29(1), 85-95.
  21. http://p-curve.com/
  22. https://mbnuijten.com/statcheck/
  23. http://graphpad.com/quickcalcs/
  24. http://www.r-bloggers.com/how-to-check-likert-scale-summaries-for-plausibility/
  25. Duval, S., & Tweedie, R. (2000). Trim and fill: a simple funnel‐plot–based method of testing and adjusting for publication bias in meta‐analysis. Biometrics, 56(2), 455-463.
  26. http://www.gpower.hhu.de/en.html
  27. http://www.r-bloggers.com/the-pirate-plot-2-0-the-rdi-plotting-choice-of-r-pirates/
Share This Post!Share on LinkedInTweet about this on TwitterShare on FacebookEmail this to someone

Doing a systematic review  2

One of my papers is going to be a systematic review, so for the past few weeks I have been busy searching and selecting articles. Of course I encountered some problems, because it would not be a PhD if everything went right the first time! Saskia thought it might be interesting if I share some of my experiences with you guys.


Search terms

So I don’t know about you guys, but the subject of my research has many synonyms. While I usually refer to my topic as being “intermediate assessment” other researchers have talked about frequent testing, continuous testing, or I don’t know how many other combinations. The problem with topics that have a lot of synonyms is that you can miss some very relevant articles, just because, for example, you only searched for testing and not for exams.

To avoid this I re-read some articles I have used in my research before to see what terms they used. Another smart strategy to define your search terms is looking for other reviews about the same subject and see which search terms they use. Of course if you do find other reviews, make sure that yours is an interesting addition!

After going through some articles I read before and thinking of common synonyms myself I decided on a list of six words that could all signify assessment and seven terms that could indicate some form of intermediateness.


Digital illustration of magnifying glass

Searching

So you’ve decided on search terms, now it is time to search! There are so many different search engines and I do not pretend to know them all, but I have used the ones that are most common in the field of educational science, which are ERIC, PsycINFO and Web  of Science. Your professor or librarian may know which are most suitable for your field.

Fun fact. When I asked Web of Science to search for a combination of my 13 search terms, it found almost FIVE.HUNDRED.THOUSAND. results. Even after refining by saying I only wanted articles related to education and educational research, there were still over 8800 relevant articles. As you can imagine this is too much to go through, so I decided to switch to search term pairs. This means I had to do several searches and for now I have only combined my seven adjectives with “assessment”. In the future I may expand my search into the other synonyms for assessment, but for now I’ve decided to go and see how many articles I can select from this.


Selecting

After running a search you are left with a long list of articles that you need to check for relevance. To make efficient use of your time this first check for selection is usually done based on the title and abstract of an article. Of course this is where you run into problems if titles and abstracts are not informative enough for you to make an informed decision. For these doubtful cases you may need to read the full article.

Furthermore, selecting is a human task, meaning that it is not totally objective. I supplied my daily supervisor with one list of search results and my criteria for selection to check my process. Whereas I selected 33 articles, he only selected 24 and of course he selected some articles that I didn’t and vice versa. So now we need to sit together and see why we chose such different articles.

If you’ve selected articles you need to download the full text for reading. Fortunately, I found 260 full text articles, out of 281 selected search results.


required-reading


Reading

After selecting the articles you can start reading and extracting the relevant information for your review. This is what I am starting to do today, so I cannot provide any tips or experiences yet, but maybe you guys have some top tips for me? For example how I am going to survive reading 260 articles in the coming months!!

Share This Post!Share on LinkedInTweet about this on TwitterShare on FacebookEmail this to someone

PhD: Prepare for humdrum Drag?  0

Although many of my friends keep asking me “How do you do this [PhD]?!” (and I keep thinking: Doing what? I just started and I ‘still’ like it…), this post won’t be about self-discipline, self-management, self-reflection, multi-tasking, meta-cognition or another kind of a PhD students’ conditional characteristic.* I enjoyed reading my colleague’s blog on being a PhD student (https://researchblog.iclon.nl/planning-everything-reading-writing-still/) and I could probably write another ten pages about this topic. However, what I chose to share with you today are my experiences with working in an inter-university research project so far.

It has been only 4,5 months since I started my PhD at ICLON. My PhD track is, just like many other PhD tracks, comparable to a (lonely) life on a private island. However, what makes my project less lonely (or less independent), are the people involved in this project; stakeholders so to say. As your research develops, more and more people will get involved. Probably every PhD student will get to the point of receiving feedback from various people with different perspectives, different goals in mind, or at least different pathways leading towards a certain goal. The starting point of my research project is: 3 universities, 3 interdependent projects, and 9 interdependent researchers. Yes: N-i-n-e. I thought it would be nice to tell you a little bit about my who-what-were-when-dilemmas a.k.a. Prepare for humdrum Drag (PhD). Note (!!!): This is not a manual including Do’s and Don’ts but simply a description of my thoughts. It also isn’t a genuine portrayal of reality but rather an exaggerated sarcastic one.


  • WHO’s the lucky one? Collaboration. I find it an intriguing phenomena as its process is dependent upon so many different factors. Among others: Expectation management. The projects we’re working on is interdependent in the sense that we’re dependent on each other’s data. This is a good thing, from a sharing-interests-perspective, as a smooth collection of data is close to everyone’s heart. However, from a responsibility-perspective it’s a little bit more complicated. Who’s doing what, where, and when? In other words: Who feels responsible? Me. For everything. Duh, that’s why I’m a PhD student (did somebody say control freak?).


are-you-a-control-freak


  • WHAT are you talking about? Something can make perfect sense to me and make no sense to others at the same time. It has only been 4,5 months since I started and I already get the feeling of being a puzzled researcher in a world of my own. What I mean to say is; Research is a process in one’s head. Before concrete products appear (such as a theoretical framework, concrete measurement instruments, or even black on white results), we think, read, rethink, reread, etcetera. As a result, meetings so far exist of brain-storming, weighting pros and cons, reformulating ideas, etcetera. In other words, the challenge is to translate our personal thinking process of, let’s say four weeks, to a meeting of two hours (with 8 other researchers also having their own thoughts).


justin-bieber-what-do-you-mean

I finally got to understand Bieber


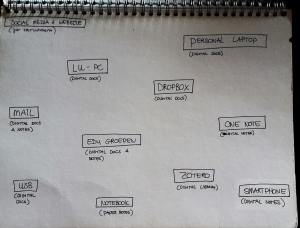
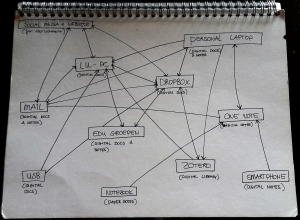
  • WHERE?  A picture can say a thousand words…


1

Where to save files & notes?  


2

Where to synchronize latest versions to?


  • WHEN: To mail or not to mail? I think this type of humdrum drag is comparable to the Dutch saying “He shot all his gunpowder” (Hij heeft al zijn kruit verschoten). On a normal working day several issues will cross your mind that you would like to discuss with others. Will you decide to wait and think about it yourself for a couple of hours or days more? Or will you mail your colleagues and ask for their input? In the latter case, be aware that 1) This may result in a day of mailing back and forth without actually moving forward (my personal record is 21 mails of 7 people within 2 hours on 1 specific topic), or 2) Your colleagues will be fed up with your e-mails and won’t respond to your e-mails a second time.


* I realize that, in the end, I actually did write about it…


Share This Post!Share on LinkedInTweet about this on TwitterShare on FacebookEmail this to someone